Edited 14 April 2026
Starting in the spring of 2024 BanyanDNA transformed the way I do genetic genealogy. BanyanDNA offers unique ways to visualize, validate, and analyze family trees. This is an overview of BanyanDNA and how I use it, not a comprehensive how-to guide. BanyanDNA has videos on their website to get you started. Hopefully some of the tips and ideas below will be useful to you.
Visualizing Family Trees
For years many genealogists have relied on tools like the free program draw.io to create diagrams to help them see connections and display useful information. These programs continue to be useful. Another option for visualizing family trees is genealogy software or online trees. In those cases, choices by software developers limit the options available to view information. If you’ve ever wanted to see multiple lines of descent on Ancestry, you understand these limitations. BanyanDNA offers a way to record and visualize complex trees and export that information as a shareable file. I now use BanyanDNA for every DNA research project.
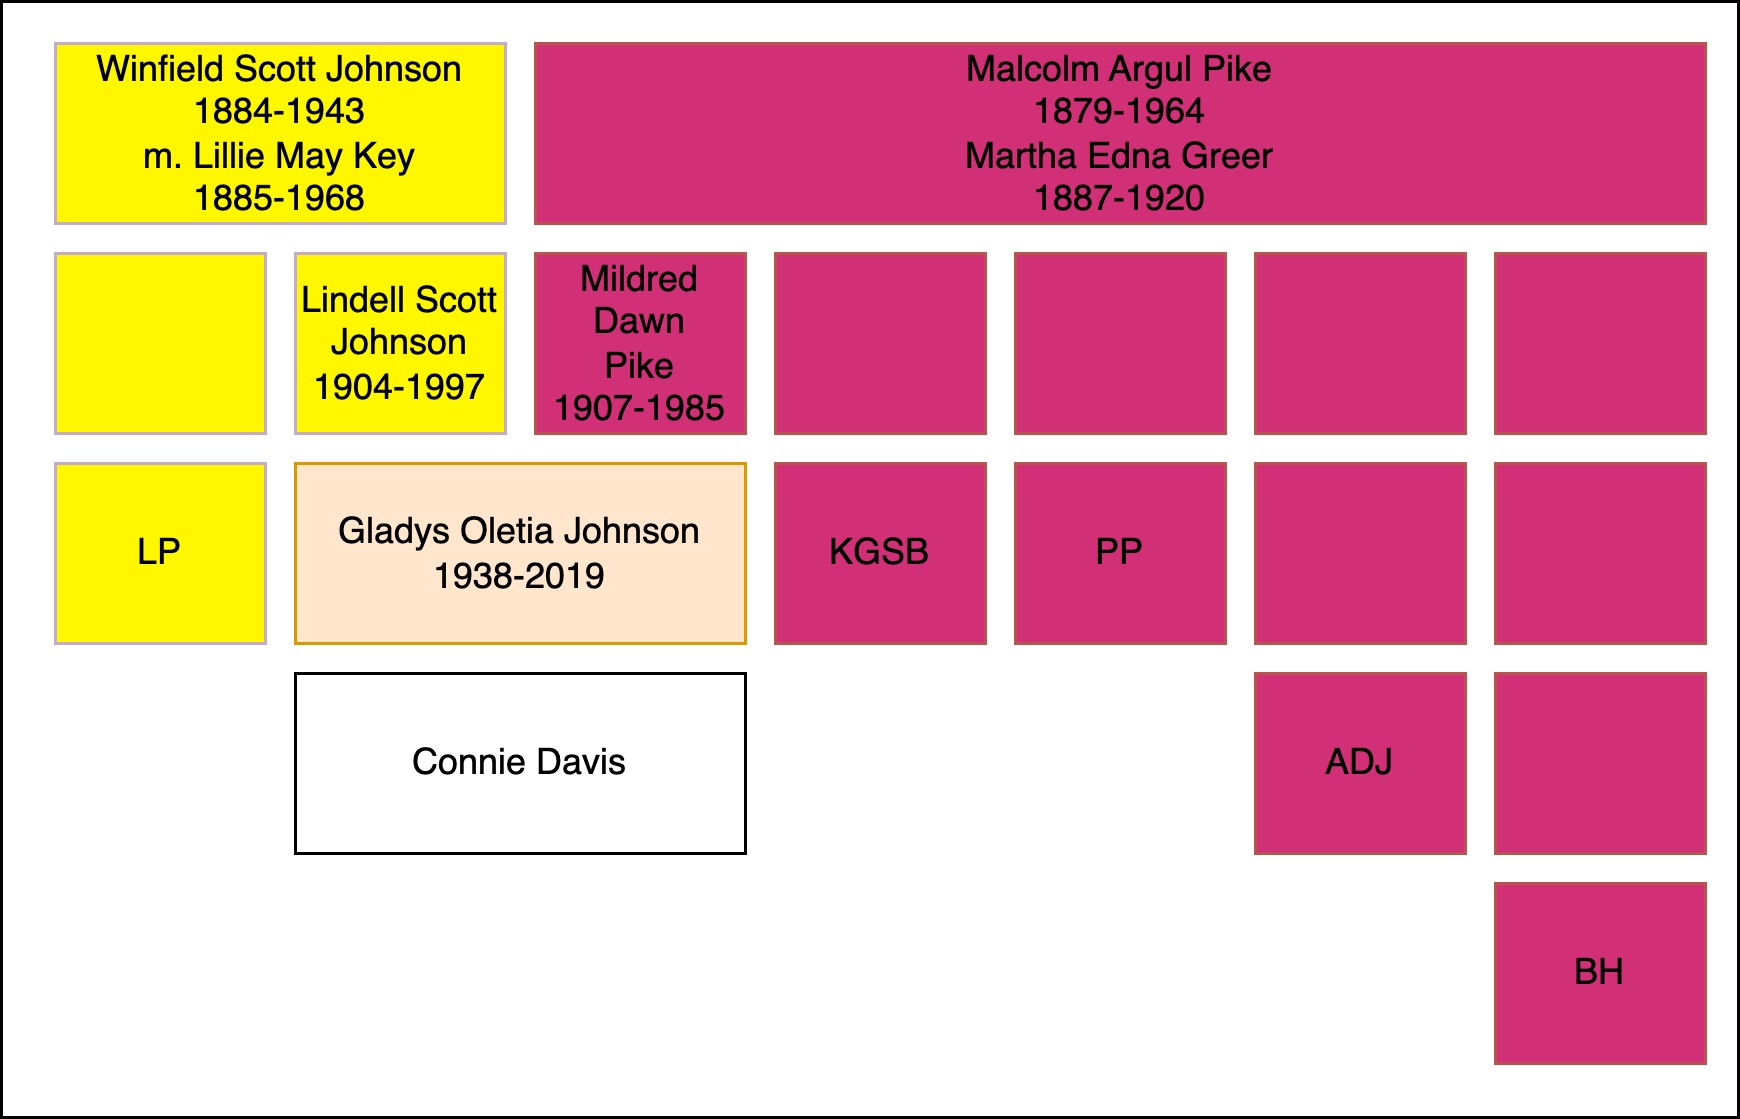
The image below is a tiny example of what BanyanDNA can do. In my family, I have more than one instance where cousins married each other or a pair of brothers married a pair of sisters. Visualizing these multiple relationships is almost impossible anywhere other than BanyanDNA. Each person is represented by a grey tile. Starting at the left, Holloway Key and his wife Catherine had two sons who married two daughters of Thomas Walker and Julina Allen. I used red lines to link Holloway and Catherine to their sons and blue lines to link Thomas and Julina to their daughters, then pink lines and purple lines to follow the relationships down to the DNA testers. Dotted lines indicate marriages and solid lines represent genetic relationships. I lined up each generation as a grid. I’ve privatized the image below beyond the privatization tools already available at BanyanDNA. My mother, Gladys, and her brother, Dawson, both supported my research efforts and are deceased and not privatized. You can see me far to the right.
The tiny purple DNA symbols in the upper corner of some of the tiles represent people whose DNA match data has been entered (by me) into BanyanDNA. I’ve done a few other things in this example, like using emojis (the purple dots next to the names of my close family in this case), which helps me use other features of BanyanDNA. I control the colours of the lines, where the tiles are placed, and how many people I include in the tree. There are additional design features, but this gives you an idea of how useful a BanyanDNA tree can be.
I could export this tree as a .json file and use it again in another project, upload it to genealogy software, or archive it. I can use BanyanDNA’s calculation menu to have it tell me all of the ways the DNA matches are related to each other. We will see examples of that later.
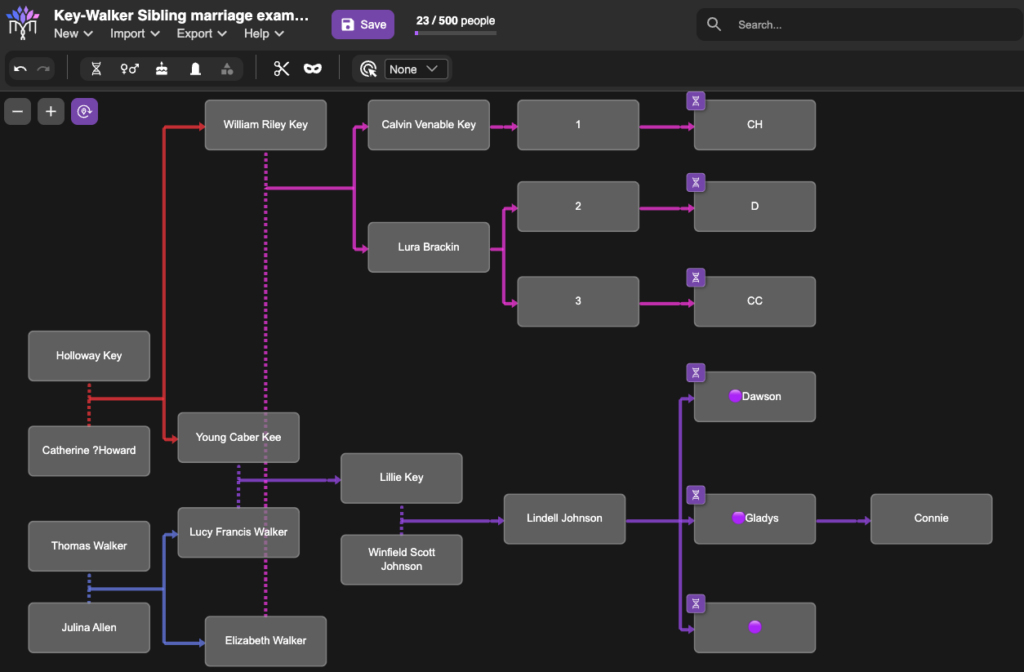
BanyanDNA trees can currently have 500 people in them, and I’ve not reached the limit in any of my projects, but I might. The image below shows relationships between multiple families in Benton County, Tennessee. Holloway, Catherine, Thomas, and Julina were among the earliest white settlers in Benton County, and over many generations, these and other early families married each other. These relationships are mostly documented, thanks to surviving records. This complicates genetic genealogy since it is difficult to isolate a Most Recent Common Ancestral couple (MRCA) when there are several. It is also harder to use relationship predictions based on shared amounts of DNA. BanyanDNA helps me with both.
In the image below, deliberately left too small to read, you can see the dashed marriage lines throughout the diagram, indicating marriages between people on the tree. In this example, I’ve used different coloured lines to designate different genetic clusters (or networks). The ability to customize BanyanDNA becomes even more important for the next use of BanyanDNA, tree validation.
Tree Validation
For decades prior to genetic genealogy, I built my family tree based on existing paper records. I enjoy documentary research and the thrill of finding a new source that illuminates connections between my ancestors. But does that tree also represent my genetic ancestors? BanyanDNA provides the perfect tool for validating family trees.
After I’ve built my tree in BanyanDNA and entered shared cM amounts between my cousins, I can use the calculation feature on BanyanDNA to validate the tree I’ve drawn. I am asking BanyanDNA and its amazing calculator: Does the DNA I’ve entered between these matches fit the tree I’ve drawn? In other words, is my tree correct?
To demonstrate tree validation, I’m switching to a different research project as an example. In another branch of my tree, I have a mysterious 2x great-grandmother, Mattie (Childres) Pike Adams. To this date, no documents have been found that identify her parents, and I’m using DNA to point me where to look for records. I know my cousins who descend from her son Malcolm. They are her only currently known DNA descendants. The image below is a portion of the tree I built in BanyanDNA for this project. In this tree, I chose to colour the lines differently, using the rainbow of line colours to remind me of generations. This helps me line up trees and floating trees correctly. I used a ❤️ emoji to designate the my genetic family, privatized here.
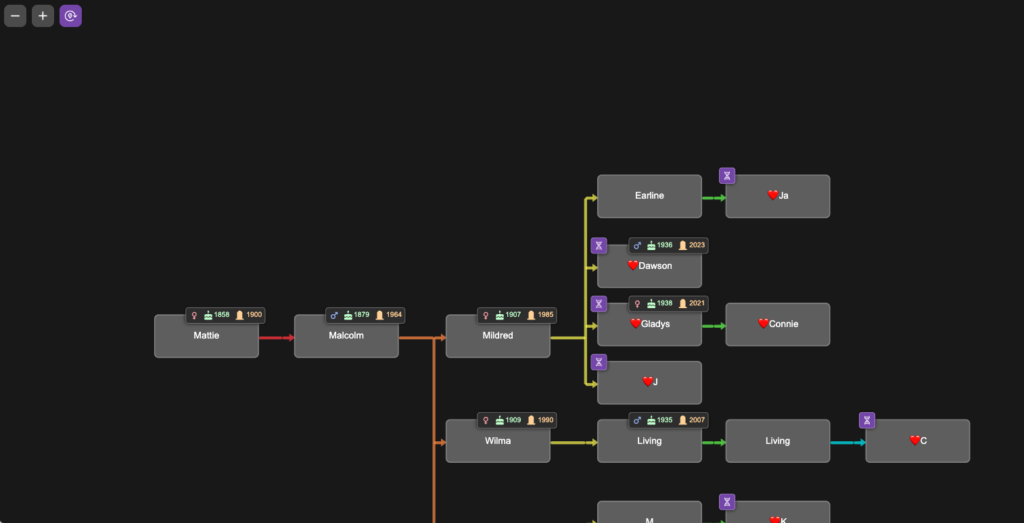
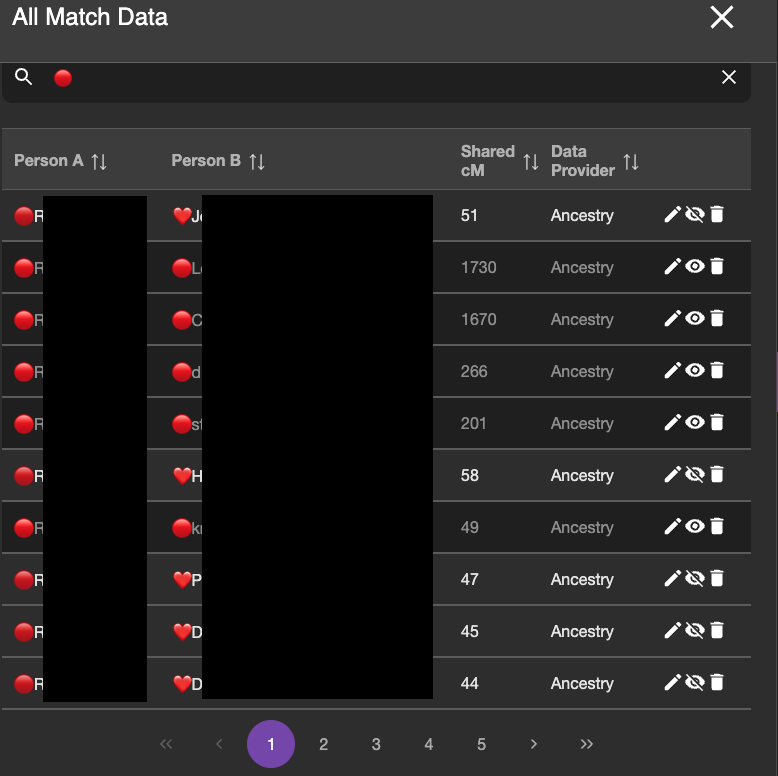
I entered DNA match data between all of the DNA testers on my branch of the tree. The image below shows the DNA view from BanyanDNA, which I have filtered by the ❤️.
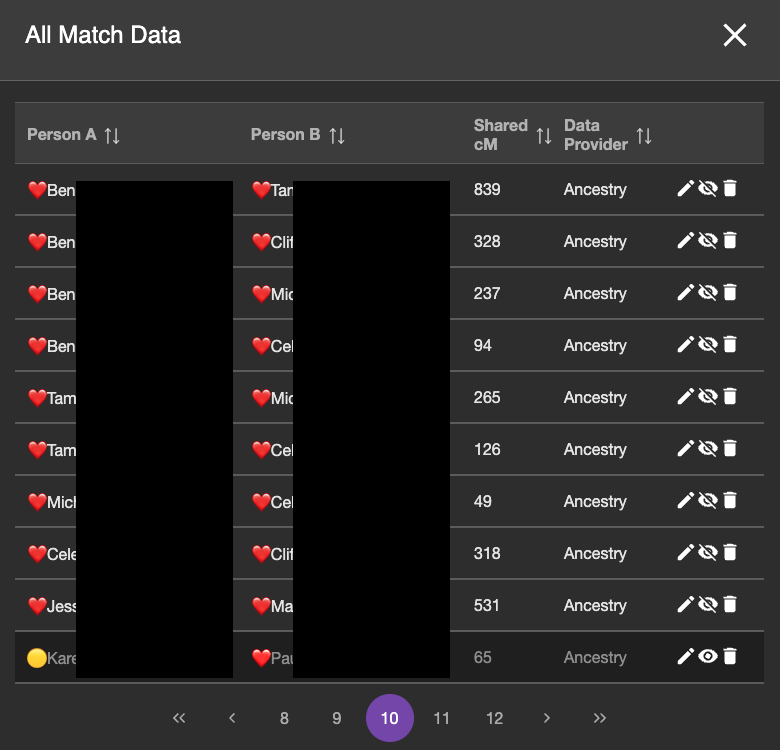
Most of the match data in this page of DNA (note this is page 10 of the DNA match data I’ve entered into BanyanDNA) are ❤️ and ❤️ DNA pairs, which is what I want to validate. The bottom match is from the 🟡 genetic cluster, so I don’t want to include it. The emojis help me sort my data and provide a visual reminder of which cluster I am working on. The eyeball symbol to the right is a toggle and I can hide which DNA I want to use in my validation calculation. You can see that the bottom row is turned off. The background is darker and the eyeball symbol looks different. (If you are like me, this eyeball toggle is backwards showing the crossed out eyeball when it is visible and the the regular eyeball when it isn’t, but that’s the way the developers did it in BanyanDNA, and I have gotten used to it.)
When I have entered all of the match data between all of the descendants of Mattie and made sure they are the only matches visible, I use the calculation feature of BanyanDNA and tell it I am doing a validation calculation. I can choose how many simulations of the data to run. Behind the scenes at BanyanDNA, there is a complex mathematical simulator. For the curious, there is a scientific paper available here that describes the math. I don’t understand the statistics, but just like my dishwasher, I don’t have to understand how it works to be able to use it. I know how to load data into BanyanDNA and push start. At the end of the validation runs, I receive a report, part of which is shown below.
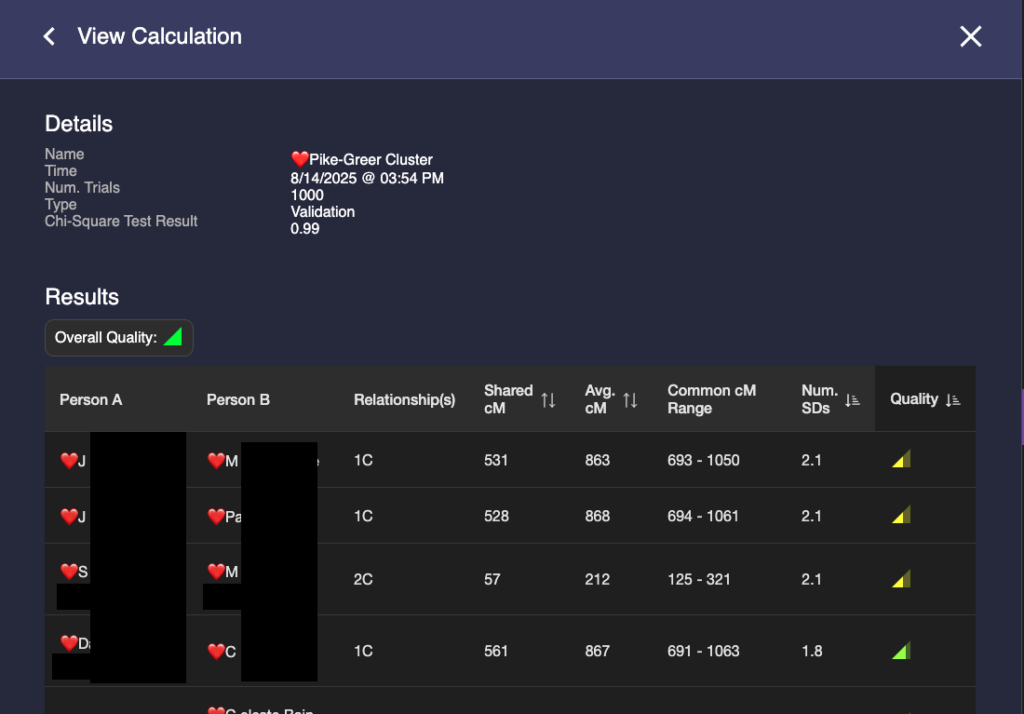
Some things to notice: In the third column, BanyanDNA tells me the relationship that it has determined based on my diagram. This is key! If I’ve drawn the diagram wrong, everything else will be wrong! And if, like my Holloway Key example above, there are multiple relationships, they will be shown here. The column I pay the most attention to is “Num. SDs.” That is the number of Standard Deviations. I know enough statistics to recall that Standard Deviations describe how the data is distributed around the mean, or average. Most of us remember the “Bell Curve” which is data perfectly distributed about a mean giving a nice beautiful curve, shaped like a bell. DNA data is not perfectly distributed. It tends to be skewed a little bit. If you want to look at DNA data, you can view the histograms (bar charts) in the Shared cM Project at DNA Painter. Click on any relationship in the chart to see a histogram, like the one below for second cousin (2C).
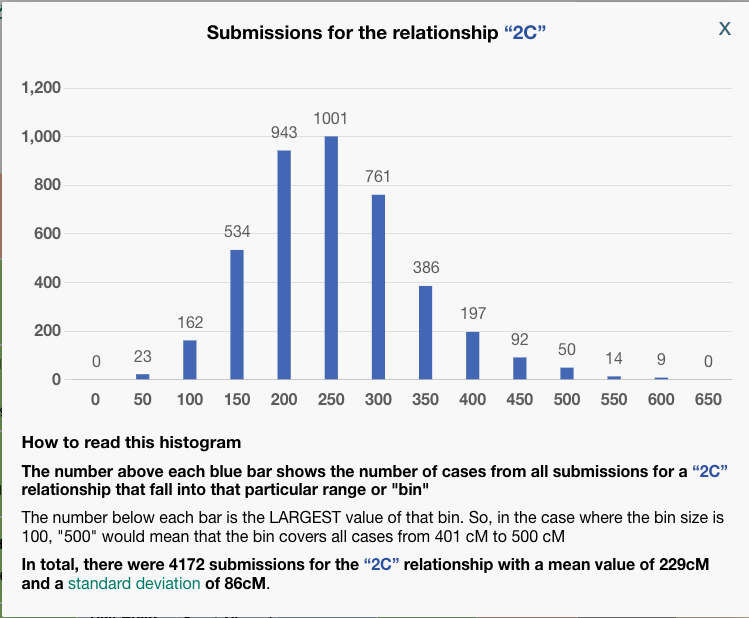
To be clear, BanyanDNA does not use the Shared cM Project data, it has its own data of the relationships, but they are based on the same human phenomenon, so they are very similar. The important point is that when evaluating a validation calculation from BanyanDNA, pay attention to the SD column. Values over 2 SD need to be explored! In the image below, I’ve shown what 2 SDs means for a second cousin relationship.
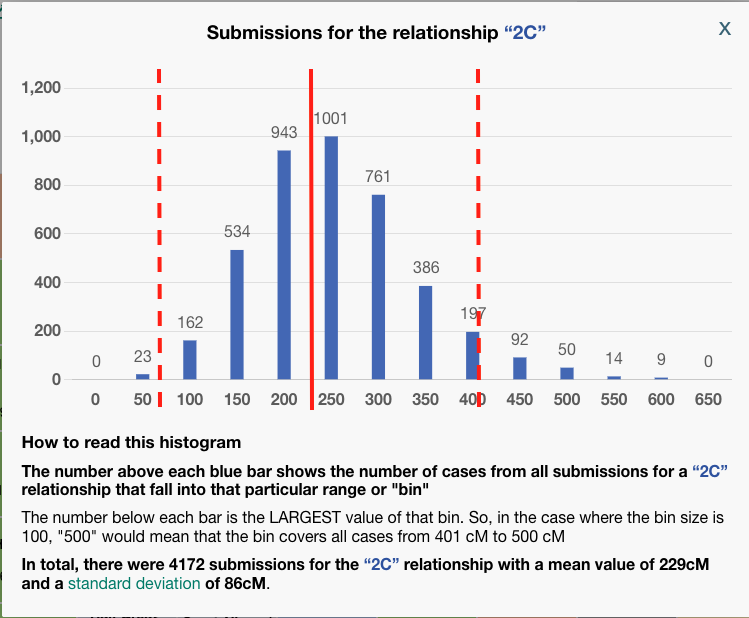
The solid red line at about 229 cM is the mean for a second cousin relationship. The histogram description tells us that the standard deviation for a 2C relationship a the Shared CM project is 86 cM. I’ve put dashed lines that are two SD away from the mean on either side. I think we can all agree, that most of the time, we would expect our second cousin to share DNA with us between the range of 57 cM and 401! That’s why whenever you get an amount above 2 SD on BanyanDNA, you need to check it out. In my example above, there are two first cousin relationships that are less than expected. I can use the columns “shared cM,” which is the value I entered, and compare it to “Avg cM,” which is what the tool at BanyanDNA says is the mean. Note: the “Common cM range” is one standard deviation, not two, and the “Num. SDs” column does not tell me if the value I entered is above or below the mean, but I can easily tell by comparing the shared cM with Avg cM.
Whenever the value is >2 SD, start an investigation. Here are the things to check:
- Was the shared cM data entered correctly? Go back to the DNA testing company site and double-check. It’s easy to miss a digit or transpose numbers.
- Was the tree drawn correctly? Is there a missing relationship (like a child not connected to both parents) or an additional relationship (like the examples above where two brothers form one family married two sisters from another)?
- Look for patterns in the results. Is there one cousin who is always a little high with everyone or a little low? Or is it just one DNA comparison that is off, and it’s nearly on the 2 SD mark like mine above? What could the pattern be telling you? For example, was a grandchild of an oldest daughter raised as the youngest child to save her from being a young single mother?
- If you have done “quick and dirty” research (for example, assuming someone else drew their tree correctly), it’s time to look for documents to verify each child-parent connection. Make sure birth dates, years, locations, names all line up and there is not a potential for same or similar-named people to have crept into the family.
- If at the end of your investigation, you still have an unexplained outlier, you can omit the data from the analysis using the eye symbol as described above.
You may be thinking, “that’s a lot of work just to validate my tree,” and depending on how big the branch is that is being evaluated, it can be. This validation is the foundation for all of other DNA work. If the tree is not correct, there is little hope of understanding how anyone else is related. I can proceed with confidence when I’ve validated my own branch of the tree and all my known matches.
This same validation process will be used for any genetic cluster found when using genetic genealogy to answer a research question, which is the third use of BanyanDNA.
Solving for a mysterious ancestor
The final use, and the purpose for which BanyanDNA was built, is to help solve family mysteries.
The overall process for using DNA to identify an unknown ancestor (including a parent), is to work from known genetic clusters to unknown. When a single DNA tester is identifying a parent, the analysis in BanyanDNA is a hypothesis calculation. I won’t cover using the hypothesis calculation here. Most of us are working on more distant mysteries, and in all other cases, the procedure I describe below will work. I’ve used the “dot system” at Ancestry or the “labels” at MyHeritage to create these clusters of shared matches. Shared matches indicate shared ancestry. Sometimes I use clusters at MyHeritage or Ancestry. The advantage of doing it myself is that I become familiar with the names of my matches.
In this project, I am using my mother’s DNA because she is one generation closer to the mystery. Mattie is her maternal-paternal great-grandparent as seen in the image below from WikiTree. Researching great-grandparents is a happy situation. Sharing a great-grandparent couple makes you a 2C, and 2C always match their full 2C. In genetic genealogy, 2C are magic!
In the image I’ve shown the other branches of the tree that are eliminated to focus on Mattie.
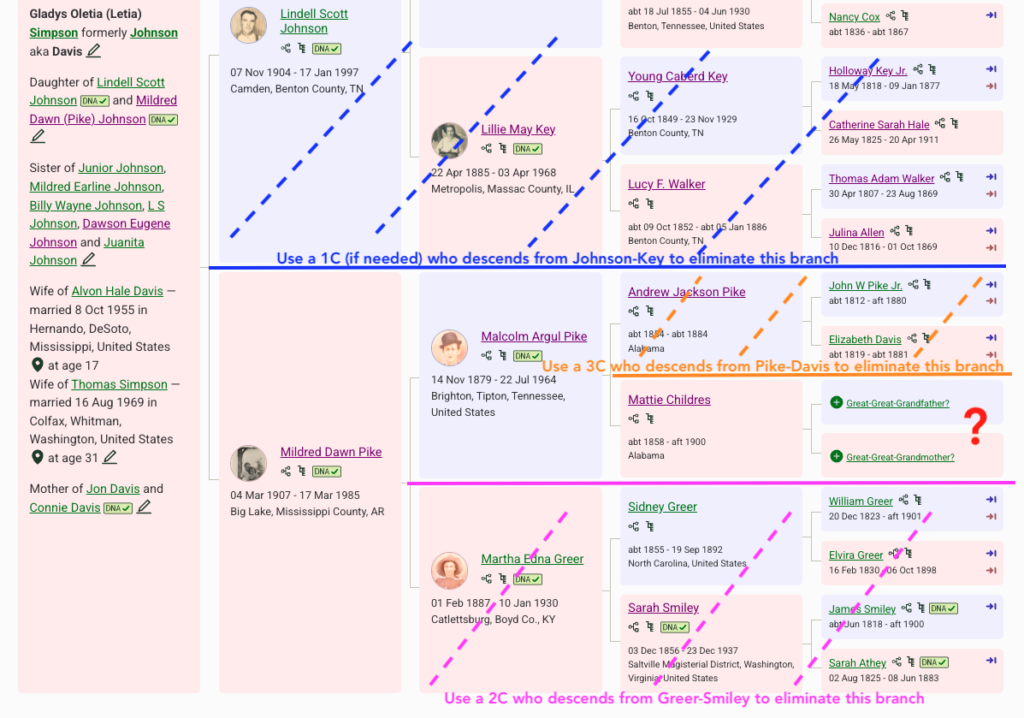
- In blue: I can eliminate the paternal side using Side View in Ancestry. I do have a caution in this situation. My mom has southern United States ancestry and there are many matches who are both maternal and paternal or undertermined. But since I want to really focus on Mattie, I am mostly ignoring any paternal match. If I start to work with more distant matches (4th cousins and beyond), I need to be careful, as there could be legitimate matches who match her on both sides of her tree.
- In pink: I can eliminate anyone who descends from the maternal-maternal side of my mother’s family tree. I know several 2Cs of my mother who descend from Sidney Greer and Sarah Smiley, so I use them to build a genetic cluster of people who descend from Greer-Smiley, mark them with dots or labels and notes, then ignore them for this project. See example below of how I use the notes field.
- In orange: I eliminated anyone who descended from John Pike and Elizabeth Davis using a known third cousin (3C). I created the cluster with dots or labels, and used notes.
- Now I am ready to look at the match list and figure out who is not a Greer-Smiley or Pike-Davis. These are the matches I want to investigate! They likely represent Mattie Childres’ ancestors.
- Since I have access to the DNA of my mother, her brother Dawson, a sister, and a maternal first cousin, I repeat this process for each of them, all great-grandchildren of Mattie. I create and mark the clusters and add the notes at the DNA testing company. I use a research log to make it easier to keep track of where I am and to transfer descendancy lines from each DNA participant to the next.
Now that I have a group of matches that I believe represent Mattie’s family, I research any existing trees that matches have built for themselves and build trees for matches without trees. My goal at this point is to figure out how the matches in the mystery cluster are related to each other. I start with the highest match and look to see what resources are easily available, hopefully a robust linked tree. If I don’t find a linked tree, I look for an unlinked tree. Using Ancestry’s ProTools, I use the Enhanced Shared matching to help me find close matches of my match who have trees. If they are a close match without a tree, I have a no whining policy. They might not have a tree or there may be only one person in their tree, but there are ways to build their trees that work surprisingly often. It’s useful to remember that our matches may not have done DNA testing to find their ancestors. Finding Mattie’s parents is my goal, not theirs, so I have to do the work to get there. I will start with the closest matches who have trees and and then I move on to the more difficult ones.
I build the matches’ trees in BanyanDNA and enter the shared match data as I build the trees. I give each cluster a unique emoji. I enter the shared match data for everyone: My family to each other, their cluster to each other, and between my family and their cluster. Looking at their family, I want to build independent lines down from the children of their common ancestor. For example, if the common ancestor had eight children who lived to have children, I’d like to see if I can get matches from most or all of the lines. Since I am doing research in the southern US, this is typically not challenging.
When I’m comfortable with the tree I have built for the mystery cluster, I imagine where my branch of the tree might fit into that cluster. I can use the shared cM amounts as a guide. For example, my mother shared 109 cm with her closest mystery match, DM. DM shares 98 cM with my mother’s sister, 90 cM with her first cousin, and 72 cM with her brother. Through Enhanced Shared Matching (available at Ancestry with a Premium subscription), I can see that DM shares 105 cM with another first cousin, 79 cM with another, and 21 cM with another. The range of 21-109 and the guess that DM is the same generation as my mother, gives me the possibility that DM is somewhere around the 3C range, exactly what I am looking for. (Recall that Mattie is my mother’s great-grandparent, and I am looking for Mattie’s parents, so my mother’s 2x-great grandparents. Third cousins share 2x-great grandparents.)
Prior to BanyanDNA, the What Are the Odds (WATO) tool at DNA Painter was the best way to check where my mother would fit in the mystery cluster. I would build the mystery cluster tree in WATO, and then add the shared match data with my mother and check to see which relationships would possible. Then I would make a copy of the tree, and delete my mother’s data, then add the match data of each the next DNA tester, like my Uncle Dawson. The limitation of analyzing one person at a time made this tedious. WATO is still a great place to start, and familiarity with the Shared cM Project and WATO is why I know that match DM is in the 3C range. BanyanDNA, unlike WATO, allows for analysis of every match against every other match at the same time. This match data is from Enhanced Shared Matching at Ancestry, shared match data at MyHeritage, or the Matrix tool at FamilyTree DNA. I can include data from any testing company in the same BanyanDNA analysis.
My mother’s match DM and I started communicating via Ancestry messaging in 2020 because DM had a mysterious great-grandmother, Rebecca Childers who was married in the Tipton County, Tennessee ten years after Mattie married A.J. Pike in that county. DM had no information about Rebecca’s parents. DM gave me collaborator access to their DNA at Ancestry in 2022.
Since I had already validated the descendants of Malcolm Pike, I now needed to validate Rebecca’s descendants using DM’s DNA. DM had a good tree and close matches that could easily be identified. I made notes on all of DM’s matches, using the 🔴 emoji. I put that same 🔴 in BanyanDNA while I built out the tree of her cluster. The image below shows what DM’s match list at Ancestry looks like as I determine relationships between DM and the MRCA George Robert Browning and Rebecca Childers.

The notes show the 🔴 genetic cluster symbol, then a line of descent from the common ancestor to the match. It’s important to record them this way because the MRCA can then be seen when scanning a match list. If a child or grandchild of a DNA match has also tested, I make a note so I can ignore offspring during analysis. If a DNA match cannot be placed on the tree, I use the notes field to record places and surnames. I make notes of how big their tree is or if they have close matches with trees. This way I can scan the notes field and look for similarities and determine which matches might be easier to figure out. I want to decrease the time I spend clicking through to every matches’ tree. (I have used more sophisticated methods of note-taking and documenting in the past, like an Airtable database, but more and more I am turning to straightforward ways to do recordkeeping. They are easier for me to maintain. Use whatever system works for you.)
After I built a good tree for the 🔴Browning-Childres genetic cluster, I validated it using BanyanDNA. A screenshot of part of the results are shown below.
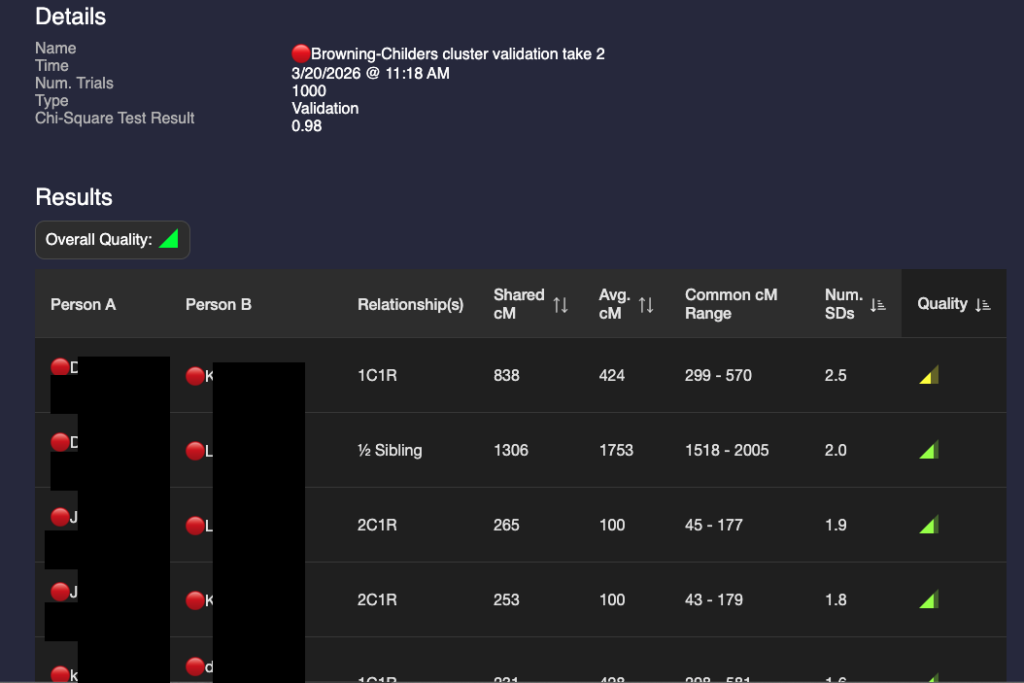
I’m not happy with that 2.5 SD in the first row. I’ve double-checked the DNA amounts and the match’s tree. I’ve looked for any pattern with other matches. So far, I haven’t figured out why this match is sharing too high for a 1C1R relationship. This amount of shared DNA is possible, but would be very rare. I’m unlikely to figure it out unless I have collaborative access to their DNA. I will not use it in calculations going forward. To remind me of this, I’ve marked it with a ? in BanyanDNA and I have hidden it from other calculations.
To summarize how we got here: I found a great match with a tree, DM, who does not match any other maternal line for my mother (process of elimination), so she must be part of Mattie’s family. DM has a great-grandmother with almost the same last name (Childers) who is about the right age to be a sister, half-sister, or cousin of my ancestor Mattie Childres. The Browning family lived in the same counties in Tennessee and Arkansas where Mattie or her son Malcolm lived. There are other people with Childres in their tree who also match the descendants of ❤️Mattie and the descendants of 🔴Rebecca. The amount of shared DNA is consistent with a sister or half-sister. I could use WATO to check out my guess, but since I have so much excellent DNA data, I will proceed with BanyanDNA by comparing two scenarios: Are Mattie and Rebecca full sisters or half-sisters? (I eliminated cousin because the amount of shared DNA is too high.)
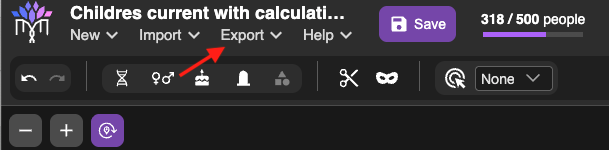
Before I continue, I will export my BanyanDNA .json file so I have a back-up copy. This is easily done with the menu at the top of BanyanDNA as shown below.
Comparing Validations
I can only do the comparison of which type of sister after I have my ❤️cluster validated and DM’s 🔴cluster validated. When I know those clusters are acceptable, I can build the tree two ways and run validations on each hypothesis. Then I compare the two validations.
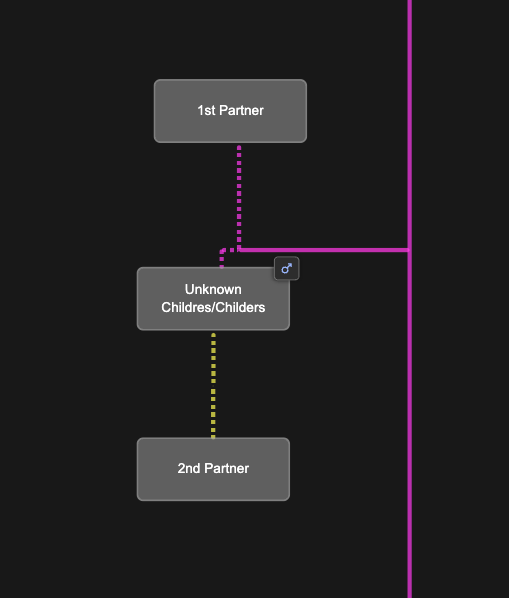
Since we don’t know exactly what the parent relationships look like between Mattie and Rebecaa, we add placeholders in the BanyanDNA tree for a Childres/Childers male and two wives as shown below. I can easily switch Mattie and Rebecca between these two scenarios.
I do not want BanyanDNA to be looking at the within cluster matches anymore. I’ve already analyzed them, so I use the “hide” tool on the DNA match list and I hide any matches that are within a cluster (❤️ to a ❤️ and a 🔴 to a 🔴) and analyze only matches that are one 🔴 and one ❤️. (Note: I could leave them as part of the calculation, but I take them out so I don’t have to wade through them when reviewing the results.) The image below shows part of the DNA list with the correct matches ready to be compared. The ones in lighter grey will be included in the calculation. The ones with the darker grey will be ignored for the calculation.
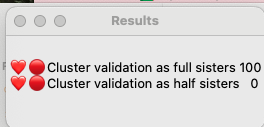
I then ran two validations: one with Mattie and Rebecca as full sisters and one with them as half sisters. I gave them names to remind me what I was validating. The validation results are below:
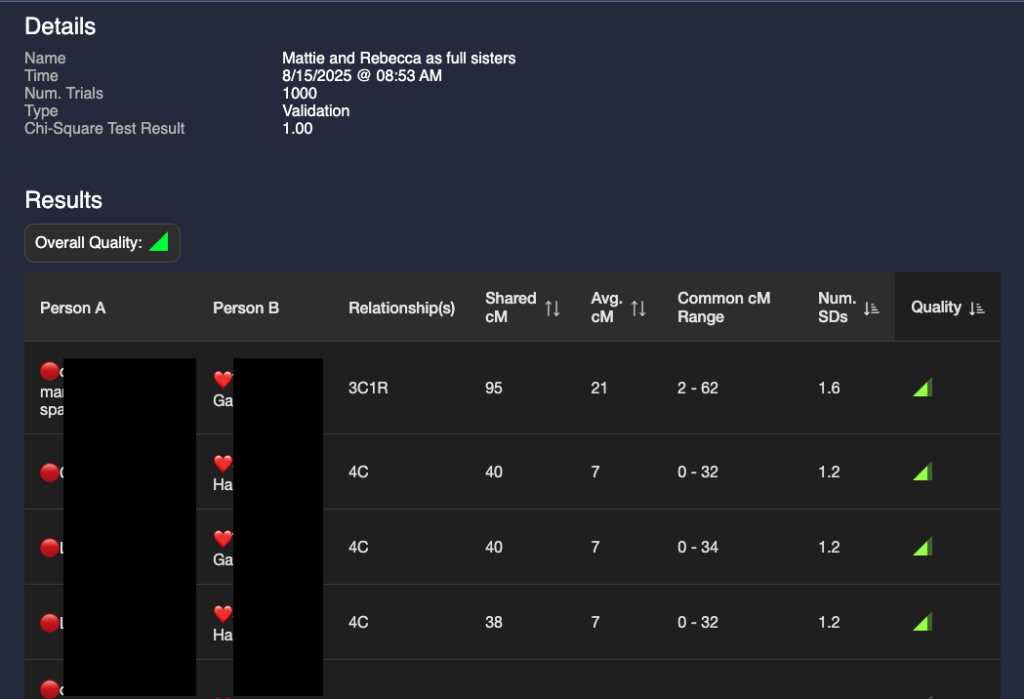
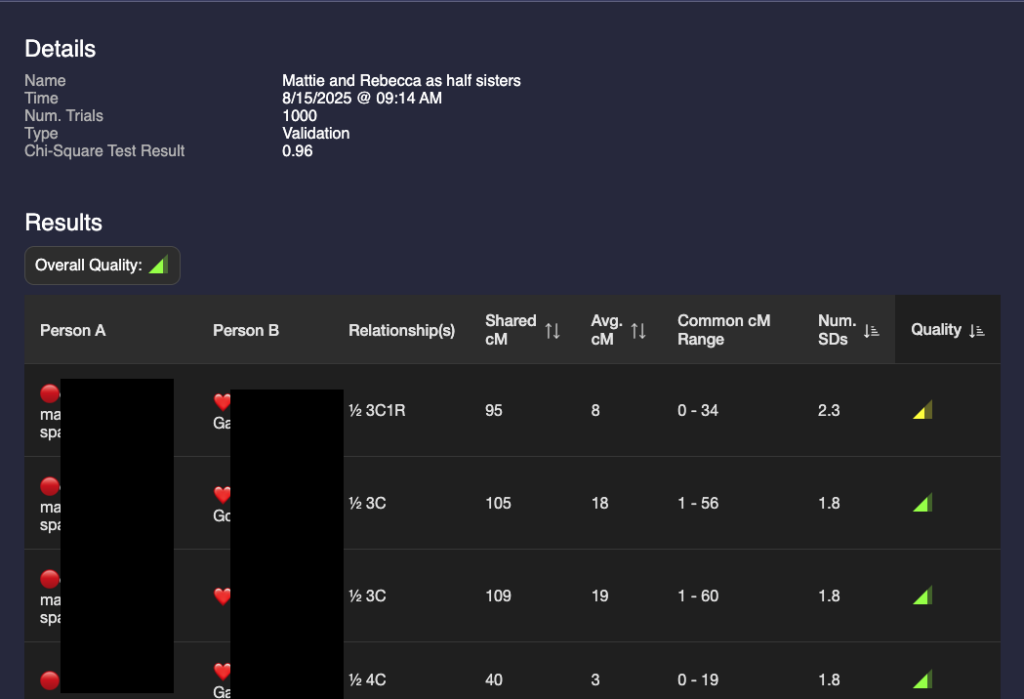
A glance at these two show that they are different but the results are not astonishingly different. I could make a guess that it’s more likely that they are full sisters, but that value of 95 for a half 3C1R is possible (4% chance according to the Shared cM project.) I need a way to compare the two validations.
In order to compare them I need to use statistics that are not currently included as part of BanyanDNA. Thankfully there are a lot of smart people who like DNA and have the statistical expertise, and one of them, Stephen Voels, built tools that use Bayesian analysis to compare two probabilities. Bayesian analysis is a way to compare the two scenarios that acknowledges that they both can’t be true at the same time. (Mattie can’t be both Rebecca’s full sister and her half-sister.) I accessed these tools through the BanyanDNA Facebook group. The tools use Python and require exporting the BanyanDNA .json file in a particular way. I’m not going into the details here, you can get that support in the Facebook group. As a Mac user, I installed Python on my Mac and was able to use the tools after a bit of external support. My son helped and so did a good genealogy buddy. This is what the Bayesian Analysis concluded:
This means that it is 100% likely that Mattie and Rebecca are full sisters and there is no chance that they are half sisters. I found this surprising, so I repeated this analysis after adding more matches. My good genealogy buddy also performed a manual analysis and got the same results, so I am pretty confident that Mattie Childres and Rebecca Childers were full sisters. I have documentary evidence that their families were in proximity over several years.
DNA Notes
Every DNA company provides a way to record notes about the match. Like many genetic genealogists, I use a line of descent method. The first part of your notes is visible in Ancestry, so make it pertinent
Notes Template:
If you know how you are related to a match or how they are related to a common ancestor in a cluster:
[Emoji]Most Recent Common Ancestral Couple>Their Child who is ancestor of your match>Their child>their child>Your Match. Other notes on this match, such as using them to create or enlarge a cluster
Example:
🔴Robert Browning-Rebecca Childres>Charlie William Browning>Lena (Browning) Gingery>private>match
8 February 2026: used to Create Browning-Childres cluster
If you don’t know how you are related to a match or how they are related to a common ancestor in a cluster:
If they have a tree: Names and places in their tree
Example:
Williams, Smith, Jones, Harrison in TN and AL
If they have a small tree or no tree: Describe the tree and their close matches to remind you how much effort it will be to build a tree for them.
Example:
Four person tree, one named person, Jackie Jones, died 1918. Two matches share >400cM with trees.
If they have a parent or grandparent who has tested, make a note of that to avoid repetitively trying to figure out who they are!
Project sharing via WikiTree
One of the challenges of working on a project of this size is to communicate with others and to share progress. I created a WikiTree page for the Mattie Childress project to aid in communication with matches. I can explain the project at WikiTree and link to all the common ancestral couples of matches before I know how they are related to Mattie. I’ve also done extensive research on the profiles of the matches’ ancestors, which they appreciate.
BanyanDNA and Project Tips
- I use Powerpoint as a scratch pad for “quick and dirty” trees. There is at least one slide for each match (unless they are siblings). I screenshot matches’ trees and copy the URLs for their trees into powerpoint. I screenshot sibling match data. I supplement this with other research I have done that leads to the common ancestor. I put the line of descent from the match in the notes on Powerpoint so I can easily copy them when I am working with a different DNA collaborator.
- Use the same emojis everywhere! ❤️🔵🔴I use them in BanyanDNA, in the notes field at testing company websites, in my research log, and in powerpoint.
- When using ProTools on Ancestry or the Shared matches at MyHeritage, remember to sort them by your match to see their closest matches. I enter all the data for every match I’m working with. This often means clicking through many pages of matches.
- When working with many DNA collaborators, remember to always check for them on a DNA match’s profile page. Shared match pages will only who matches who share defined amounts of DNA. You can bypass this by going to the profile page, then use the dropdown menu and see if they match all of your collaborators. You will find some small but significant matches this way. And if they don’t match, record this also! See below
- When I find a match who does not share DNA with a DNA collaborator, I enter 1 cM in the match field at BanyanDNA. This is a reminder that I looked for a match and didn’t find it, which is different than not looking at all. I avoid 0 since I don’t know if it is 0, it could be anywhere between 0-7 and not be shown at Ancestry. 0 can also throw off calculations if I forget to hide them. I hide all 1 cM matches at BanyanDNA and do not use them in calculations.
- In BanyanDNA make sure your emoji is right next to the person’s name or you won’t see their name when you use the privacy filter: 🔴Robert
- In BanyanDNA, if I have entered a match and they are an outlier on a validation, I add a ? to their name 🔴Robert?. I can then search for them and make sure I have hidden them from calculations. I leave them in because I may eventually figure out where they fit.
- In BanyanDNA, remember to sort by Standard Deviation, highest to lowest because it’s the high ones that require investigation.
- In BanyanDNA, I enter children who have tested as a reminder in case their name comes up in a match list. I do not give descendants of a tester an emoji.
Next steps
I still have not answered my question of who were Mattie’s parents, but I’m closer now than I was before. I recently came across a scrap of paper in my mother’s records that say Mattie had three brothers: Greene, William, Charlie, and a sister Manive. I identified a Childress family in Alabama in 1850 and 1860 that has a Green, William, Charlie, and a Manerva as well as a daughter Martha of about the right age to be Mattie. There were men named Green, Bill and Charlie Childress in Tipton county Tennessee in the 1870s. Using the shared matches who descend from both Mattie and Rebecca, I have identified clusters that could represent Mattie and Rebecca’s mother and additional Childress clusters. Among the descendants of Rebecca Childers, there is a potential mtDNA tester, which could help me in the future.
Stay tuned for the results of the Mattie Childress research project and I hope that this example and tips about process guide you if you decide to incorporate BanyanDNA into your genetic genealogy research.