The Lure of Small DNA Segments

Several times a year I am asked about a small segment match. For the purposes of this blog, I am considering anything below 8 centimorgans (cM) a small segment.

Many experienced and eloquent genetic genealogists have written on this topic. The titles of their articles include a spoiler alert:

Measuring DNA

To understand why small segments are deceptive, it’s important to understand how DNA matching is measured. When you look at a DNA match list at any company, you will see the shared cM amount between you and your match. But that’s not all they use to determine if you are a match. Each company has a threshold for sharing which incorporates shared cMs and other characteristics of the DNA data. This may include matching on one or both chromosomes (remember you get one from each parent), the SNP density (referring to how rich the genetic information is – a very complex topic I don’t pretend to understand), the number of segments you share, and endogamy. Endogamy is the situation where groups of people, often geographically or culturally isolated, partnered with each other over hundreds or thousands of years. The result is that you can have many relationships with your matches, which inflates the amount of shared DNA. If you come from an endogamous population, you need to share more DNA in larger segments to be considered a DNA match. The ISOGG wiki has a table that compares the DNA testing companies matching criteria in detail. Search for “Criteria for matching segments” in the ISOGG Wiki link.

In genetic genealogy, we create images of shared cMs that make measuring DNA look like a simple thing you could do with a ruler, with coloured bars indicating shared segments of DNA. In the image below, I’ve used DNA Painter, importing data from known paternal DNA matches in the blue shaded portion near the top of the image and known maternal matches in the pink section in the lower part of the image. Each different coloured bar represents a different shared ancestor.

A public version of my chromosome painting from DNA Painter

The most basic definition of shared cM dances around the issue of what is actually being measured:

cM: “a unit of measure for autosomal DNA segments. The more DNA we share with someone in centimorgans, the more closely related we are.” Leah Larkin PhD

These simple images and definitions cover up the wealth of science behind what is actually being measured. The ISOGG Wiki provides the following definition for centimorgan:

A centimorgan…is a unit of recombinant frequency which is used to measure genetic distance. It is often used to imply distance along a chromosome, and takes into account how often recombination occurs in a region. A region with few cMs undergoes relatively less recombination. The number of base pairs to which it corresponds varies widely across the genome (different regions of a chromosome have different propensities towards crossover). One centiMorgan corresponds to about 1 million base pairs in humans on average. The centiMorgan is equal to a 1% chance that a marker at one genetic locus on a chromosome will be separated from a marker at a second locus due to crossing over in a single generation.

Whoa! This definition reminds me that I will never understand everything there is about genetic genealogy, and that there are scientists who developed the strategies the DNA testing companies use. Blaine Bettinger has summarized company information on segments and matching here. I have to keep reminding myself that cM measurement isn’t like the length of ribbon, it’s about how likely it is that the DNA will split apart when an egg or sperm is being made.

False matching

Even with all of this science, a match on your match list at a DNA testing company might not be real. How can that be?

That small segment might be a pseudosegment, a false segment which leads to false matches. This can happen because the DNA company takes your DNA apart into the two chromosomes and puts it back together again. Sometimes it is put back together wrong, weaving back and forth between the father’s and mother’s DNA. The smaller the segment, the greater the chance it is a pseudosegment. (For more information and an illustration, see Identical By Descent in the ISOGG Wiki.)

If you have transferred your DNA to another testing company (FamilyTreeDNA and MyHeritage allow DNA transfers) or you are using the third-party site, GEDmatch, your small segment might be due to imputation or be from a known pile-up region.

Imputation. Whenever anyone does a DNA test, there are some regions that can’t be read (“no-calls”) and those sections are estimated (imputed). This happens at every DNA testing company. If a DNA company has changed their testing chip over the years they use imputation to allow them to analyze the DNA in the sections of the chip that differ. For companies that accept transfers and GEDmatch, there will always be imputation because of the number of different chips they are analyzing and comparing to each other. Every company does imputation using the methods their scientists have developed. Imputation can create a small segment and it can also separate a larger segment into two segments. Roberta Estes has a three part series in her blog on imputation starting here.

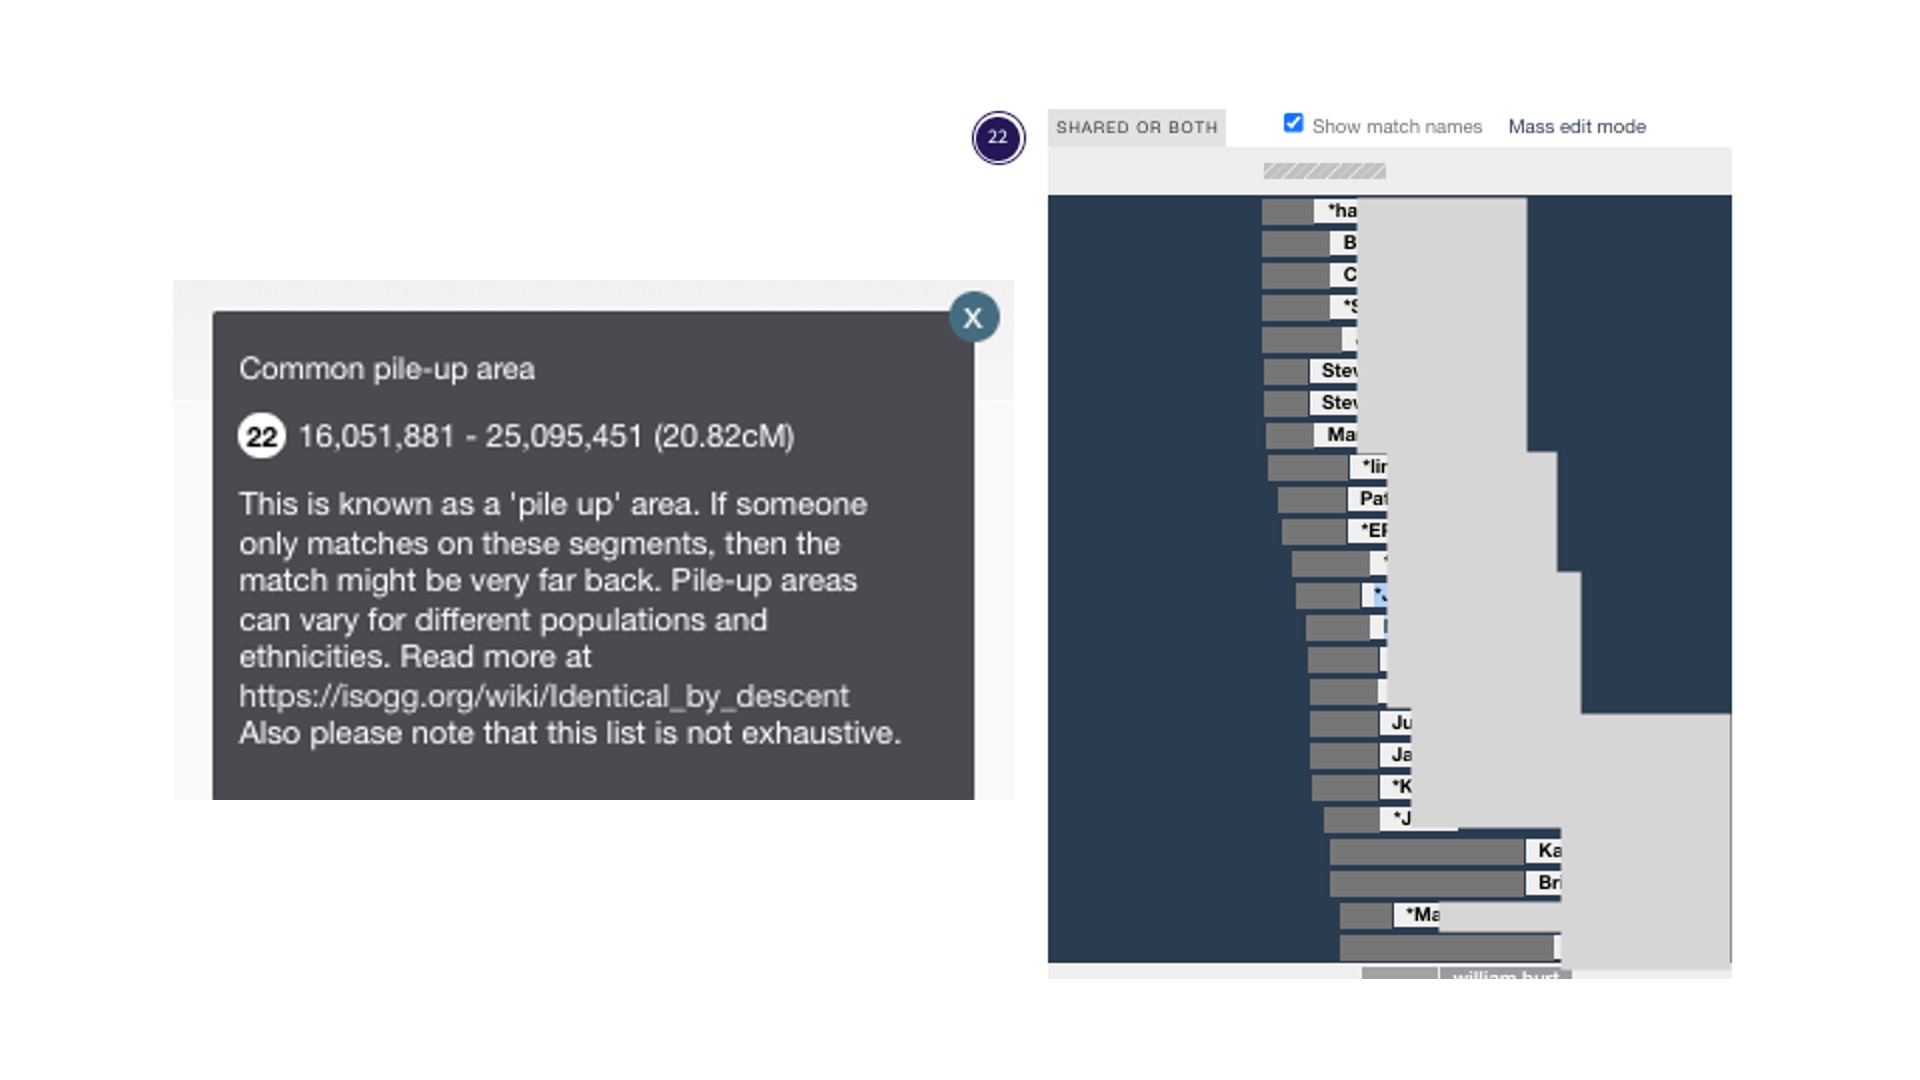
There are pile-up regions where many people have the same DNA. These are also called excess IBD (Identical by Descent). Testing companies don’t report those regions (they have algorithms that leave them out of DNA matching), but GEDmatch reports these regions. More on that in the ISOGG Wiki. Jonny Perl has included the known pile-up areas in DNA Painter; a grey bar with horizontal stripes appears above each chromosome where they are known to happen. In the image above of chromosome 1, you can see the grey bar in the middle above the blue-shaded area. When you click on the grey bar, you will find additional information about that pile-up region. I’ve provided a close-up below of a pile-up region for Chromosome 22. The explanatory text box is on the left. The painting on the right shows data from GEDmatch. In 2023, I shared DNA in this pile-up region with 75 people. I know it’s a pile-up area because there are so many matches and I can see the grey bar with the diagonal stripes at the top. I don’t consider these DNA matches even though they share 10-14 cM with me on that chromosome.

DNA Painter notation about a pile-up area on Chromosome 22 and an example of my match data from GEDmatch

Two additional complications with small segments

Many people do DNA testing to learn more about their country or region origin. Some companies call this ethnicity results. The best term for this kind of data is biogeographical ancestry – where your distant ancestors were at a point in time. That information is also in our chromosomes. That’s complication number one. Your small segment could be Identical by Population, as described by Roberta Estes.  Everyone or almost everyone who descends from people on the same migratory population path for thousands of years has the same segment of DNA.

Complication number two pertains to your goal. Many of us do DNA testing because we want to find our ancestors and give them names. We can do that if our matches occur within a genealogical time frame, defined as the time when their might be documents to help us. Your small segment could be from an ancestor not within a genealogical time frame. Using simulated DNA data, Leah Larkin has found a 10 cm match could be a 9th cousin, meaning you share 8x great-grandparents. For most of us, this is at the edge of documentary genealogy. A smaller segment, such as 7 cM could be from a 10th great-grandparent or a 40th great-grandparent or there is a 58% chance it is false. (Simulated data from Leah Larkin. Data on false segment size is from Tim Jantzen in the ISOGG Wiki. See Blaine Bettinger for company specific information on false segment sizes. )

At the third party DNA site, GEDmatch, you can alter the matching thresholds to below what the testing companies are doing. This is where the danger lies. Just because you can set a lower threshold doesn’t mean you should.

But I match someone with a LOT of small segments!

If all of the segments are small, the most likely explanation is endogamy. As mentioned earlier, the strategy for working with endogamous communities is to use larger segments and avoid the small ones. If you are working with an endogamous community, you will be applying different strategies to analyze your DNA. Paul Woodbury has a two part series Dealing with Endogamy. He also lectures and teaches courses. You can seek out presentations and courses by Dr. Adina Newman. Diahan Southard offers an Endogamy Course (full disclosure, I work for Diahan Southard as a coach). Leah Larkin, the DNA Geek, periodically offers an Endogamy lecture and writes about Endogamy in her blog. I recommend all of these from personal experience.

A rational approach to using segment data

With documentary genealogy, we know we need to start with the present and work our way back. You can do the same thing in genetic genealogy using segment data. Jim Bartlett, author of the blog segment-ology, calls this “walking the segment back.”

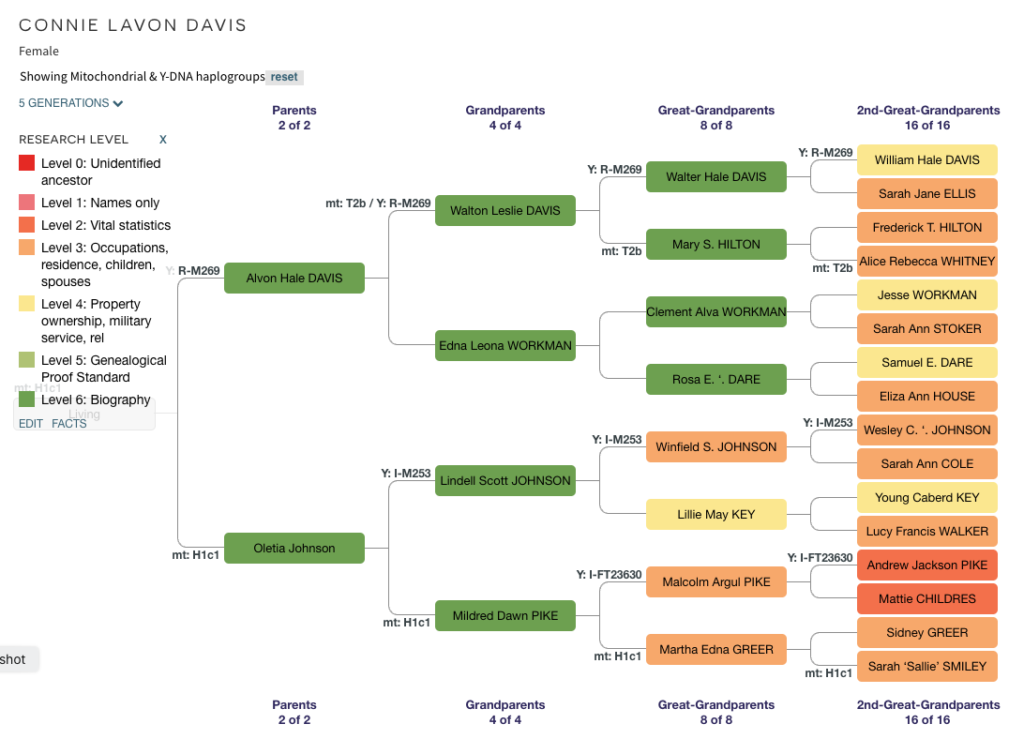
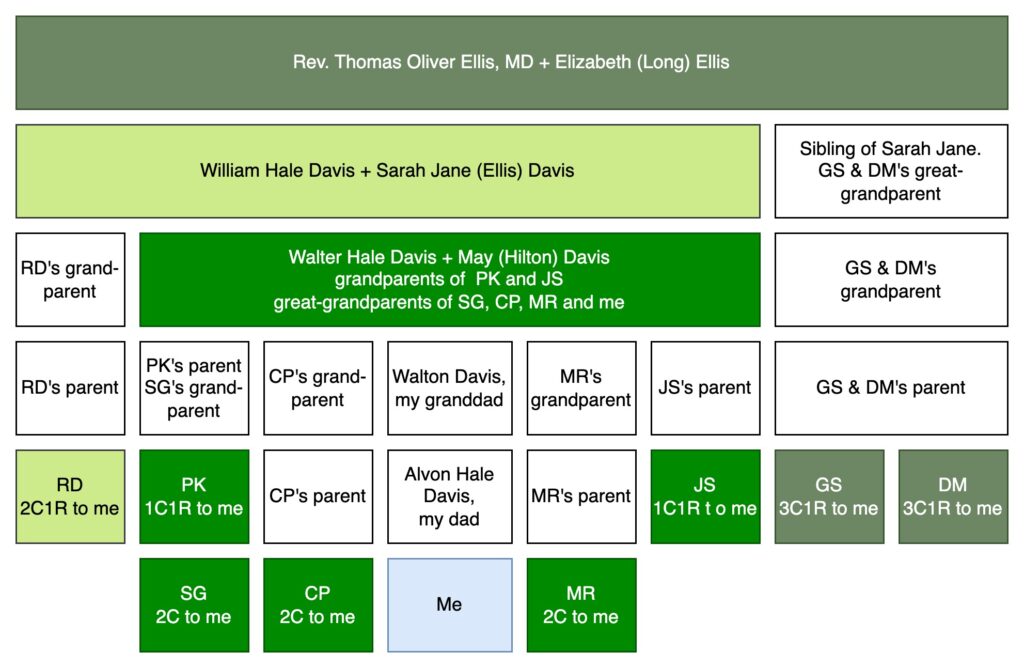
Let me introduce you to some of my ancestors and DNA-tested cousins in the image below. Skip to the next paragraph if this type of family tree diagram is familiar to you. If it’s not, what follows is a description of the diagram and a reminder of relationship terminology and abbreviations. In the image, I’m at the bottom in a light blue box. My dad is immediately above me, then my granddad, then my great-grandparents, Walter Hale Davis and May (Hilton) Davis in green. All the cousins that I share with the ancestral couple of Walter and May are in green. SG, CP, MR, and I are second cousins, because second cousins share great-grandparents. PK, CP’s parent, my dad, MR’s parent, and JS are all first cousins to each other because they share Walter and Mary as grandparents. Since I am one generation younger than these first cousins, I am their first cousin once removed (1C1R). Moving up the diagram, Walter’s parents were William Hale Davis and Sarah Jane (Ellis) Davis. A descendant of Walter’s sibling has also done a DNA test. RD is shown in a light green to match William and Sarah Jane. Since William and Sarah Jane are RD’s great-grandparents and RD is one generation older than me, we are second cousins once removed (2C1R). And up at the top are my 3x-great grandparents, Rev. T.O. Ellis, MD and his wife, Elizabeth (Long) Ellis, in the dark green. I share this ancestral couple (T.O. and Elizabeth) with two cousins (siblings, GS and DM) also in dark green in the lower right. T.O. and Elizabeth are the 2x-great grandparents of GS and DM, so we are third cousins once removed (3C1R).

Ancestors and corresponding DNA matches in relationship to me

MyHeritage and FamilyTreeDNA allow DNA testers to download the segments you share with your DNA matches. If you know your relationship to a DNA match, you can assign the segment to an ancestral couple. In the image below of Chromosome 1, I started by “painting” the DNA from my great-grandparents, Walter Hale Davis and May (Hilton) Davis with green. You always receive DNA from great-grandparents, so that’s a great place to start painting your DNA. I painted the segment data from two 1C1R (PK and JS) and three 2C (SG, CP and MR). I didn’t really need SG since their parent has also tested, but it is a good illustration of how DNA segments tend to get smaller every generation. The lightest green match (RD) is a 2C1R who shares my 2x great-grandparents, William Hale Davis and Sarah Jane (Ellis) Davis. If you look at the comparison of PK to RD, you can see that RD is contained within the green segment from my great-grandparents. This makes sense. The DNA from PK came from either my Davis ancestor or my Hilton ancestor, and it’s clear that most or all of it came from Davis, since I don’t share Hilton ancestors with RD. Then I have two siblings, DM (13.2 cM) and GS (11.8 cM) who both descend from my 3x-great grandparents, Rev. Thomas Oliver Ellis, MD and Elizabeth (Long) Ellis. The same pattern holds: the segment fits within the segment from RD, who is both a Davis and an Ellis. Dark green is either Ellis or Long or both.

Detail of Chromosome 1 DNA Public Version of a DNA Painting at DNA Painter.com

I may some day find a cousin who descends from Rev. Ellis’ father, Josiah Shelton Ellis, or more distant ancestors, but the chances get increasingly remote as we go further back in time. If an ancestor has no or few siblings, the line could have died out. If there are recent immigrants, they may not be in the testing databases. By using this methodology, I can be more confident that a smaller segment came from a more distant ancestor. Note: The smallest segments I painted are both over 10 cM and came from 3x great-grandparents and 3C1R matches. The average segment size for a 3C1R is 16 cM based on simulated data from Leah Larkin.

If you are interested in using segment data, consider encouraging your matches to upload to MyHeritage. Why? It’s free to upload your DNA, they have good privacy protections, and in addition to being able to gather the data for chromosome painting, there are other useful tools for genealogy at MyHeritage.

The constant plea: Test the oldest generations of your family now!

We can enhance our reach by testing the oldest generation. They will have larger segments to work with and are one step closer to your ancestors. If you have any older relatives (parents, aunts, uncles, cousins one generation older), buy a DNA test for them. (Watch for sales!) Then visit them personally and make sure they do all the steps for the DNA kit to be activated and usable.

Summary

Genetic genealogists avoid using small segments when making genealogical conclusions. There is science behind the limitations of DNA matching. Genetic genealogy needs to be treated like documentary research: start with the present and work your way back.


Learning more about genealogy research

The internet continues to excel at what it was designed to do: Share information. For family history researchers, the free sharing of methods and resources has transformed a pastime that was once championed by the elite eager to prove descendancy from royalty to a hobby that proves we are one family.

I’ve compiled a list of free resources and learning opportunities for people who are just getting started or want to make sure their documentary genealogy research is on a firm foundation.

FamilySearch: FamilySearch is the largest database of free genealogy records and guidance on how to do genealogy. The FamilySearch Wiki is one of the first places I turn when starting a new project.

  • Research Resources: This part of the Wiki includes a section on Beginning Genealogy with a section on the research process, tips on choosing software, how to use the Wiki and research tools. There is more information on this page than any one genealogist knows.
  • Guided Research: This feature of the Wiki will walk you through how to research birth, marriage and death records in many localities around the world. Use the map to identify the locality you want and follow the links.
  • Main Wiki Page: From the main page, you can find the resources available for any locality, down to the county level in the US.

National Genealogical Society: This membership group has been around for over 100 years and publishes the National Genealogical Society Quarterly, the most prestigious genealogy publication. Recent diversity and inclusion efforts are encouraging.

African American Research: The continued efforts to share records related to African American history and the legacy of enslavement has meant more is possible than ever. Because of systematic attempts to hide the reality of slavery, records can be hard to find. African American research does require a great deal of persistence and unique approaches to discovering ancestors.

Legacy Family Tree Webinars presents genealogists talking about what they do best. Members have access to the full library of recordings, and many recordings are free for the first week.

  • Register here for free live webinars and check out other pre-recorded webinars on the same page.

Family History Research Companies all have free resources, often as a blog or as a series of videos. Taking the time to learn from their experts can make your research more efficient.

I set aside time every week to continue to learn more about family history research. I’m grateful there are free resources for researchers of all experience levels.

Research Like a Pro Week 2: Timeline and Citations

This is the second entry about my experience doing a research project while I serve as a peer group leader for the Research Like a Pro Study Group hosted by Diana Elder and Nicole Dyer of Family Locket.

Updating the Research Objective

With the assistance of my peers, I revised my research objective to be:

This project seeks to uniquely identify each James Stoker in Bourbon County, Kentucky from approximately 1820 to 1880. 

  • James Stoker filed a bond to marry Polly Ross on 9 December 1822 in Bourbon County.
  • Jas. Stoker, age 79, lived in the household of his son-in-law, Silas. Cleaver, in 1880 in Millersburg, Bourbon County. 
  • James H. Stoker, presumed age 40-50, lived in Bourbon County in 1830.

The task this week was two-fold: create a timeline of known facts and to cite them properly.

Timeline

Creating a timeline involves taking everything already known about the research topic and arranging it in order. This provides an opportunity to see new patterns and identify gaps in the research. I am using Airtable to organize my research.

I entered the documents I had about the various James Stokers into the timeline tab in Airtable. My timeline has the following fields (columns): Event, Stoker as named in record, Stoker sorting tests (more on this later), Date (text field YYYY-MM-DD with as much information as is known), Place (Single-select field type written State, County, Town using 2 letter state abbreviations), Type (of event, another single-select field with choices like birth, census, death), URL (to the source document), Source citation (yes, the entire citation. This is the master location for the citation), Details (an abstract of the information in the source), FANS (link to the FAN Club table), Notes (thoughts about the source).\

I included all the known events for my ancestor James Stoker since I had eight census records for him (two are state censuses). I have a birth state, birth date calculated from his cemetery marker, marriage date and place, death and cemetery information.

Since this is a project to distinguish different people of the same/similar name, I am testing using two columns for name, one as it appears in the record, and the second column to try different ways to sort the James Stokers. Place and time will guide the sorting.

Citations

Complete source citations form the foundation for genealogical analysis. Fortunately, I formed good habits citing my sources starting in 1998 when I was enrolled in the certificate program in Family History and Genealogy at the University of Washington. Citations weren’t as exacting then as they are now. Citation is also required in my other field, health care, and I worked in research for several years and co-authored scientific publications. Transitioning to the professional genealogist role meant switching to humanities-style citations and meeting genealogical standards. I frequently refer to the Chicago Manual of Style to manage the mechanics of humanities writing and citations. I refer to Elizabeth Shown Mill’s comprehensive book, Evidence Explained, and Thomas Jones’ Mastering Genealogical Documentation as needed.

Using a template for genealogical citations made it easier for me to meet the genealogical standards. I have an Airtable Citation Guide accessible from my bookmarks bar. It is based on the Research Like a Pro templates. The fields in my base are Name (type of source, like Birth Certificate Original, FindAGrave, Pension File), Category (birth, cemetery, military, for example), template (see example below), Citation Example (a completed citation of that type), Short Form (when citing the source multiple times.) I tend to put more in citations than others (like complete dates instead of just years and complete stable URLs) because I can always shorten the citation if needed.

Here is an example of a template for FindAGrave:

Find A Grave, database and images ([Stable URL] : accessed [DD Month YYYY]), memorial [NNNNN], [Name As Appears], ([BBBB-DDDD]), gravestone photographed by [Contributor], citing [Name of Cemetery, Town, County, State].

And the 1921 Canadian Census at Library and Archives Canada:

1921 Census, [Province], [name] District [#], Enumeration Sub-district [#], page [#], dwelling [#], household [#], [Name as Written]; database with images Library and Archives Canada ([stable URL] : accessed [DD Month YYYY]); citing LAC microfilm [#].

Creating the timeline and the source citations supports the next part of the research process, analyzing the evidence.

Research Like a Pro Week 1: Getting started and the Research Objective

This fall I am volunteering as a Peer Group Leader for the Research Like a Pro Study Group hosted by Diana Elder and Nicole Dyer of Family Locket. Making the transition from family historian to professional genealogist required me to become a more disciplined researcher. The team at Family Locket supported me on my journey through their podcast, books, courses, and presentations at conferences. I’m a process person likely due to my background in quality improvement. Throughout my healthcare career, the Model for Improvement guided our efforts with the message “Every system is perfectly designed to get the results it gets.” (Paul Batalden, often quoted by Don Berwick). To improve as a genealogist, I needed to change my system. In this case, that’s the research process. For the next ten weeks, I will share my insights into the Research Like a Pro process. This course is focusing on documentary research. As a peer group leader, I will be completing a project with the participants. It’s a great opportunity to work on my own family history.

Pedigree Analysis

Identifying potential areas for research is the first step in making the most of your research efforts. Analyzing your pedigree accomplishes this step. DNA Painter provides multiple ways to visualize your family tree. The first thing I checked was my tree completeness. This tells me where I have gaps in my tree and also reminds me about pedigree collapse, which is a subject for a different blog.

Tree Completeness Report from DNA Painter

I’m missing two 3x-great grandparents and sixteen 4x-great grandparents. A fan chart, like this example from DNA Painter is another way to look at the gaps. On DNA painter, hovering over each colored shape brings up the name of the person represented in that space on the chart. That feature isn’t shown in the image below since I can’t capture the hovering. You can use this link to see it for yourself. My father’s side of the family is on the left and my mother on the right. I’ve coordinated these colours to resemble the coloured dots I use on Ancestry to mark my DNA matches.

FAN Chart from DNA Painter Showing Location of Mattie (Childres) Fisher Pike Adams

The arrow indicates the location of the most recent ancestor whose parents I don’t know. Many refer to this as a “Brick Wall.” I could continue documentary research on Mattie for this course. During the Research Like a Pro with DNA e-course I completed, I identified several families that could be Mattie’s parents.

Another opportunity is my 3x-great grandfather, James Stoker, shown below.

James Stoker in DNA Painter Fan Chart

My grandmother believed he was the son of Edward Stoker, a Revolutionary War Veteran. During ProGen 46, I took a look at the link between generations from Edward Stoker to my 3x-great grandfather James and realized there were multiple men named James Stoker who could have been his son James, as noted in a Stoker family Bible. Several of them left records in Bourbon County, Kentucky around 1820 where my ancestor James Stoker married Polly Ross on 9 December 1822. I also noted that the birth date of James Stoker in the family Bible of Edward Stoker (found in his Revolutionary War Pension file) did not match the birthdate of my 3x-great grandfather. Many family trees shared on Ancestry confuse the James Stokers, and the Ancestry hinting algorithm points to Edward Stoker. WikiTree has my James Stoker linked to Edward. The FamilySearch Family Tree has a note about the confusion: ” Be aware…. Another Individual, ‘James T Stoker’ was born in Kentucky and resided most of his live [sic] in Nicholas County, KY. Married Sytha Ann McDonald 20 Dec 1827 in Nicholas Co KY.” I didn’t fully analyze the same-name people when I first discovered the confusion. Thoroughly researching the men and writing up the results would be a contribution and help me correct the WikiTree entry.

Another way of analyzing my pedigree and determining where I could focus is using Yvette Hoitink’s Level Up Challenge. I started working on improving my genealogy based on her approach after she published this idea in her blog in January of 2021. The levels describe the completeness of your research for each ancestor. In some cases I’m not sure which level to give because I write a biography for everyone on WikiTree. I may not have researched all property records (some parts of my family were very mobile) or know every church denomination they attended over time. I used DNA Painter’s Dimensions “Research Level” feature to create this chart.

Research Level at DNA Painter

Based on this diagram, my efforts would be to continue researching my mother’s family, particularly Andrew Jackson Pike and Mattie Childres that I designated as Level 2. (Note: See the YDNA and mtDNA haplogroups? That’s a neat feature of the tree on DNA Painter, and another project is to complete my YDNA and mtDNA tree like Roberta Estes does). I spend a lot of time researching my mother’s family and have neglected my paternal grandmother’s family including James Stoker.

I haven’t written up a same-name case before, so that’s my choice for this project. I expect that writing clearly will be the biggest challenge. For reference, I have two National Genealogical Society (NGSQ) articles I reviewed during my NGSQ Study Group. One is by Shannon Green, who was my mentor in ProGen 46. The other is by Allen R. Peterson and Stephen J. Allen. Both are found in the December 2019 NGSQ

File Organization

Our assignment this week also asks us to describe how we name and organize files and how our choices support our research.

I organize documents in two ways depending on where I am in the research process. My basic family history files structure relies on folders for the surnames of each of my sixteen 2x-great grandparents. Within those folders there are sub-folders for individuals. Women are filed under their maiden name, since it is the only constant. While I am working on a specific project, I create a project folder within the surname or person. Project folders start with a number like 01-Mattie Childres Father so that it will sort at the top. Within each project folder, there is a sources folder.

I use the following naming conventions for files (.jpg, .pdf, .docx, etc.) so that the folder becomes a timeline:

YYYY-MM-DD_LASTNAME_Firstname_Middleifpresent_STATE_County_Town_type.file

  • Dates: YYYY-MM-DD format keeps them sorted. I include as much detail as I have. It could be year only, year and month, or all three. If I don’t have the exact date, I use the best information I have and put “ca” after the date so I know it is approximate and the sorting order is maintained.
  • Names are written as they appear in the record with the surname in ALL CAPS. The caps help me scan the files for surnames and variations.
  • State is the two-digit state or province abbreviation.
  • Type is the type of document
  • File is the extension (pdf, jpg, docx).

Examples:

1840_STOKER_Jas_KY_Bourbon_census.jpg

1882-11_SMILEY_James_KY_Floyd_court.jpg

1955ca_DAVIS_Alvon_AK_Kodiak_letter_to_DAVIS_Edna_transcription.docx

When I complete a project or identify a document I know I want to cite in Reunion (family tree software for Mac) I make a duplicate and add the source number that Reunion assigns to the beginning of the name and file it in a a digital folder in my Reunion folder.

Filed in Reunion:

2622-1882_11_SMILEY_James_KY_Floyd_court.jpg

I keep any useful paper copies in plastic sleeves in 3 ring binders in numeric order of the Reunion citation. I should invest in some archival safe plastic sleeves for the few originals that I own.

Research Objective

A possible research objective is:

The goal of this project is to identify which of multiple James Stokers known to have been in Kentucky was the son of Edward Stoker. Edward Stoker served in Capt. John Lemon’s Company during the Revolutionary War and died 7 May 1846 in Nicholas County, Kentucky.

Another option is:

The goal of this research project is to clarify the identities of men named James Stoker in Bourbon County, Kentucky from approximately 1820 to 1840. James Stoker filed a bond to marry Polly Ross on 9 December 1822 in Bourbon County. Jas. Stoker, age 79, lived in the household of his son-in-law, Jas. Cleaver, in 1880 in Millersburg, Bourbon County. James H. Stoker, presumed age 40-50, lived in Bourbon County in 1830.

I have additional information about the men named James Stoker in Kentucky but I think it would confuse the objective. I can put it in the next section of my research project document, summary of known facts. The objective identifies Edward Stoker, because I realize he is the person I can identify at present. I look forward to receiving feedback from my coursemates!

Exploring the 1950 U.S. Census

Like any avid family history researcher or professional genealogist, I had known for years that the 1950 US census would be released on 1 April 2022. As the release date drew near, the number of articles, presentations, and blog posts about the 1950 census grew exponentially. Many people prepared to spend hours searching for their families starting at the stroke of midnight. I wasn’t among them. Why? I anticipated the website crashing under the weight of so many people trying to access the database. I might also have decided to go against the grain and not get caught up in the drama. Part of me wanted to learn from everyone else who went first. What I learned was that it was a rousing success so I set aside some time this morning to explore.

Background on the 1950 census

The 1950 census is the first census to be released with Machine Learning and Artificial Intelligence technology. A machine reviewed the census and created a searchable database of names based on interpretation of handwriting. That’s amazing! It’s a far cry from the days of using the Soundex and microfilm in a dark room at the National Archives poring over faded copies for hours. It’s not quite what researchers have become accustomed to: a census that is indexed and easily searchable on more than one website. That’s coming soon.

Based on early ideas about using the 1950 census, I was prepared to spend hours looking for the Enumeration District (ED) where I thought my family might be. The machine-derived index made that irrelevant for my first searches. The index will be updated with human effort over the upcoming months. Indexes for the first two states, Wyoming and Delaware, have been released at MyHeritage. Ancestry and FamilySearch also have the images available and are working on indexing. Each company has unique search capability and index. Whenever you can’t find your family in an index, before giving up or resorting to reading each page, check an index at a different website.

For the machine-derived index, keep in mind that enumerators recorded information by household. Typically, the surname appears next to the head of the household and usually a straight line or nothing is written for subsequent family members of the same surname. That meant I wouldn’t be looking for my father and mother who were children at the time. I would be searching for my grandfathers.

The challenge: How long would it take to find my parents?

The two surnames I was searching for, Davis and Johnson, are incredibly common and my family wasn’t living in rural or remote areas in 1950. I was prepared to slog my way through reading many pages before I found them. Before I began, I reviewed a useful article by Teresa Koch-Bostic which is available for members of the National Genealogical Society. Then I started my timer.

Finding Dad: 9 minutes and 26 seconds

Here are my steps and what I found:

  • I reviewed my father’s timeline from my genealogy software, Reunion. I knew the family lived in Hollister, San Benito County, California. My dad graduated June 1952 from San Benito County High School.
  • I entered the National Archives website and clicked on search.
National Archives 1950 Census Welcome Page
  • I completed the information I had for state, county, and name, entering California, San Benito, Walt Davis (my grandfather’s name, the head of the household). I soon realized that Last Name, First Name order would be an improvement, but not crucial to success. I also noticed that the machine picked up the name David for Davis (see red arrow below), which is a good thing, since terminal letters in handwriting are often difficult to decipher. I switched my strategy and re-entered the name as Davis Walt. (His full name was Walton but he often went by Walt, and sometimes was confused with Walter, his father.)
1950 Census Search for “Davis Walt” in San Benito County, California
  • I scrolled the results and the 26th name I encountered was my grandfather, Walton Davis. The family appeared on the bottom of page 1 and the top of page 2.
1950 U.S. census, San Benito County, California, ED 35-2, page 1
1950 U.S. census, San Benito County, California, ED 35-2, page 1 with my father enumerated as “Alvaughn Hale Davis” (red arrow)

A close review of the page revealed the amount of information captured in the census. Although none of the information surprised me, seeing the names of my grandparents, uncle, and father, all gone now, made me smile. My grandmother’s stories of the auto dealership and garage sprang to mind and I could almost smell the oil and gas and see my grandfather disappointed with his challenges in receiving the type of cars he wanted to sell. I could picture my 16-year-old dad and his 17-year-old brother in coveralls with flat top haircuts, pumping gas and working in the garage.

My next step was to record the information in Reunion. The data entry took an additional 15 minutes because I created a new citation template for the 1950 census and added other useful information from the census to all the family member’s profiles. I updated my grandfather’s WikiTree biography and I will need to do the same for the rest of the family members.

Finding Mom: 1 minute and 47 seconds

I repeated the strategy for my mother, looking for my maternal grandfather, (in reverse order) “Johnson Lindell,” in Dyer County, Tennessee. Bingo! Six names down the list, there he was, along with his entire family (including my mother) at 420 Kist Avenue, the house I remember from my childhood (see arrow number 1, below). My great-uncle, his son and my great-grandmother all appear to be at the same house number, but I believe the second house was already on the property at that time. I’ll have to ask my uncle. My grandfather worked at the cotton mill down the street, as did my Aunt Earline, on line 22 (enumerated as Mildred E. Coleman.) A couple of their neighbors also worked at the mill. My great uncle A.W. (line 25, household 87) was delivering pottery. I grew up using the peach-shaped sugar bowl my mother received from his time driving the pottery truck.

Two family members appear in the supplemental information at the bottom of the page (arrow #2). The census used a sampling strategy and enumerators recorded additional information for every fifth person on the census. My uncle L.S. was on line 18 and my cousin Jimmy was on line 23. The corresponding lines in the bottom section show information about residence in past year, nativity of parents, schooling, work, income, and military service. The information for Uncle L.S. is interesting. He was 16 years old and the information indicates he had completed 4th grade and did attend school in 1950. He is over 14 but the next section is blank, when the section header indicates it should be filled out for anyone 14 or older. His enumeration data above on line 18 noted he was working, delivering papers. Jimmy was two, so the information for him isn’t very revealing. Important information may be here in other situations. It could be the impetus for searching military records, understanding the family’s social situation, or the key to discovering an immigration pattern.

My examples were simple cases. I knew the exactly where the families were living and both were reasonably-sized communities. I knew the address of one place but I didn’t need it. If I were doing research on a family that relocated often and was in an urban setting, my results would have been different.

Your turn!

I’m looking forward to catching up on other family members in 1950. I don’t have any burning questions right now about my family in that time period, so it’s likely I will coordinate gathering 1950 census information as I improve the biographies of my family on WikiTree. And the data might be important for upcoming client work. I’m glad I took the few short minutes to explore the 1950 census. I’ll be back soon!

Happy searching!