Genealogists commonly encounter errors in census data. But what about the deliberate misuse of census data to cause harm? The 1840 census illustrates how census data were used for ill.
Family historians rely on information from census records, hoping to identify family units and to trace location and situation over time. The 1840 census, like those from 1790 to 1830, documented families under the name of the head of household and counted other household members by age, gender, race, and status of free or enslaved. The informant was unknown and could be the enumerator, a neighbour, or any member of the family.[1] Over time, the data collected for each census varied, depending on the priorities of the government. Data from the first census in 1790 determined Congressional representation and funding for the new government.[2]
As the government’s need for information grew, the census data accommodated that need. By 1820, naturalization status and involvement in agriculture, manufacturing or trade were assessed.[3] Collection of information about health or functional status began in 1830 with enumeration of those who were deaf, deaf mute, or blind. In 1840, the enumeration included those insane (referring to people with mental illness) or idiotic (referring to those with developmental or intellectual disabilities) and if they were supported by private or public means.[4]
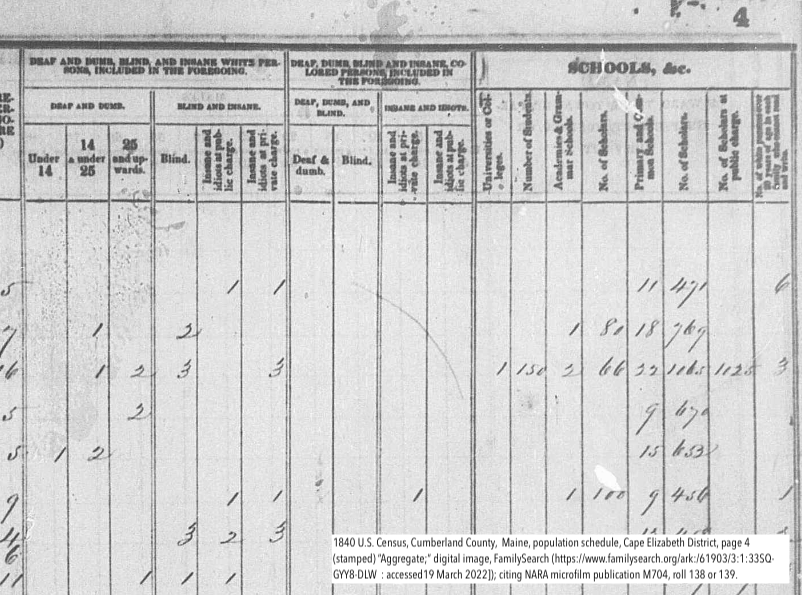
As any family historian knows, the information in the census can be flawed at the individual level. The misinformation may have occurred at the time of enumeration, with ages guessed, misstated, or misunderstood. Location information is primary and most reliable, since the enumerator went from dwelling-to-dwelling collecting information. Errors could be introduced during transcription since each enumerator created multiple copies. Fraud by the enumerator was also a possibility.[5] Data were recorded across large sheets in columns. Standardized forms introduced in 1830 improved collection of census data.[6]
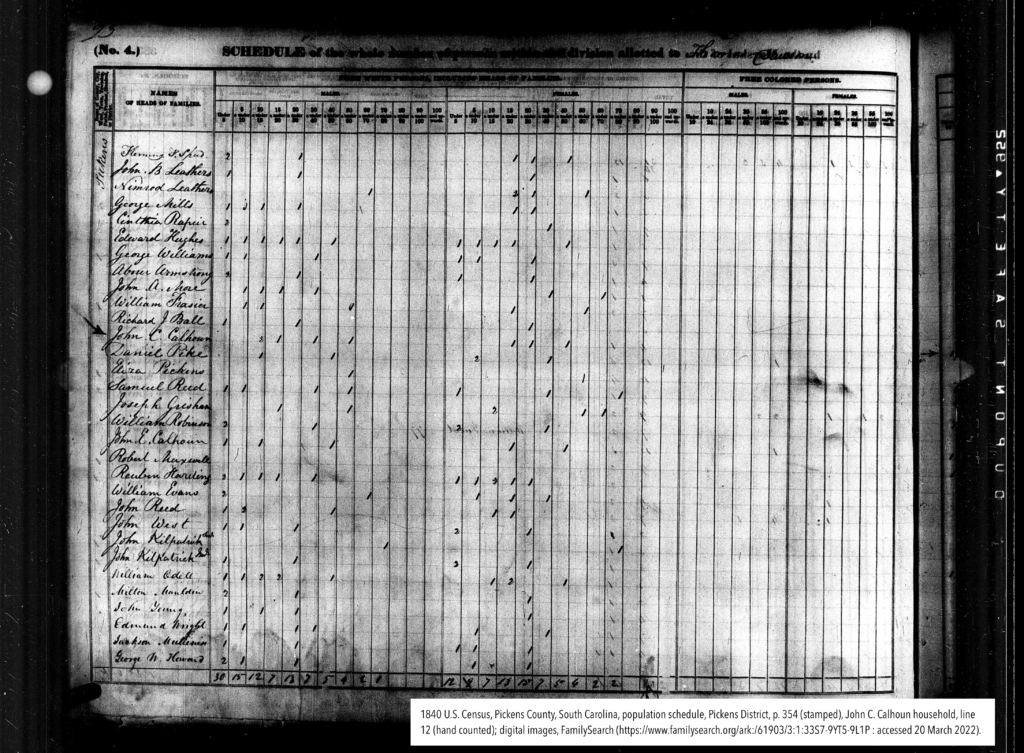
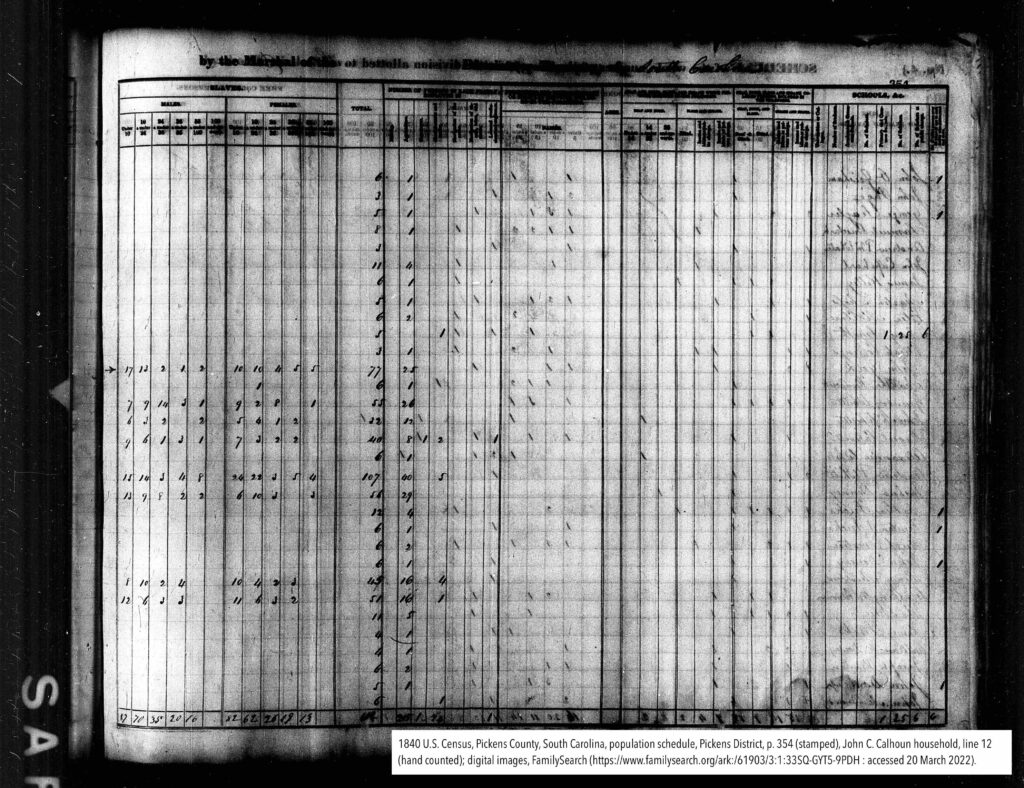
Congressional reports collated census data to inform policy, and the 1840 census was no exception. The Compendium of the Enumeration of the Inhabitants and Statistics of the United States, as Obtained at the Department of State, from Returns of the Sixth Census supported arguments of politicians in slaveholding states because it reported that the percentage of “colored persons” who were “insane and idiots” was higher in northern states compared to southern states.[7] The statistics showed that “the negroes and mulattoes of the north produced one lunatic or idiot for every one hundred and forty-four persons, while the same class at the south produced only one lunatic or idiot for every fifteen hundred and fifty-eighth.”[8] Politicians like Senator and former Vice President John C. Calhoun of South Carolina claimed that slavery benefited “the African race.” In an 1837 speech he said, “I may say, with truth, that in few countries so much is left to the share of the labourer [referring to enslaved people], and so little exacted from him, or where there is more kind attention to him in sickness or infirmities of age.”[9] The census bolstered Calhoun’s pro-slavery politics and his personal finances as an enslaver. The John C. Calhoun household in 1840 included seventy-seven enslaved people.[10]
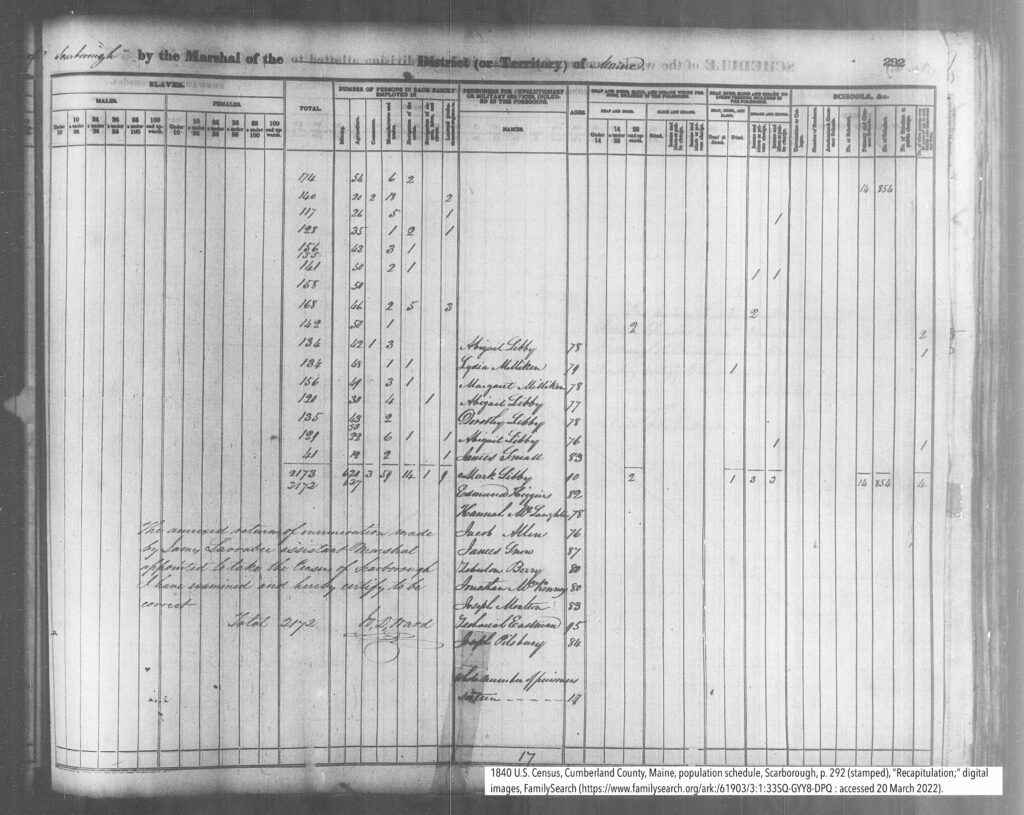
Dr. Edward Jarvis, a specialist in treating mental disorders, used the time he was convalescing from a broken leg to study the 1840 census records. Jarvis reviewed the entire census and recalculated the totals, noting multiple errors in the tallying of the data for free colored people.[11] An example is the census of the community of Scarborough in Cumberland County, Maine. No free people of color were enumerated in Scarborough, but the totals include 6 “colored persons” who were classified as “idiots and insane” as shown in the image below.
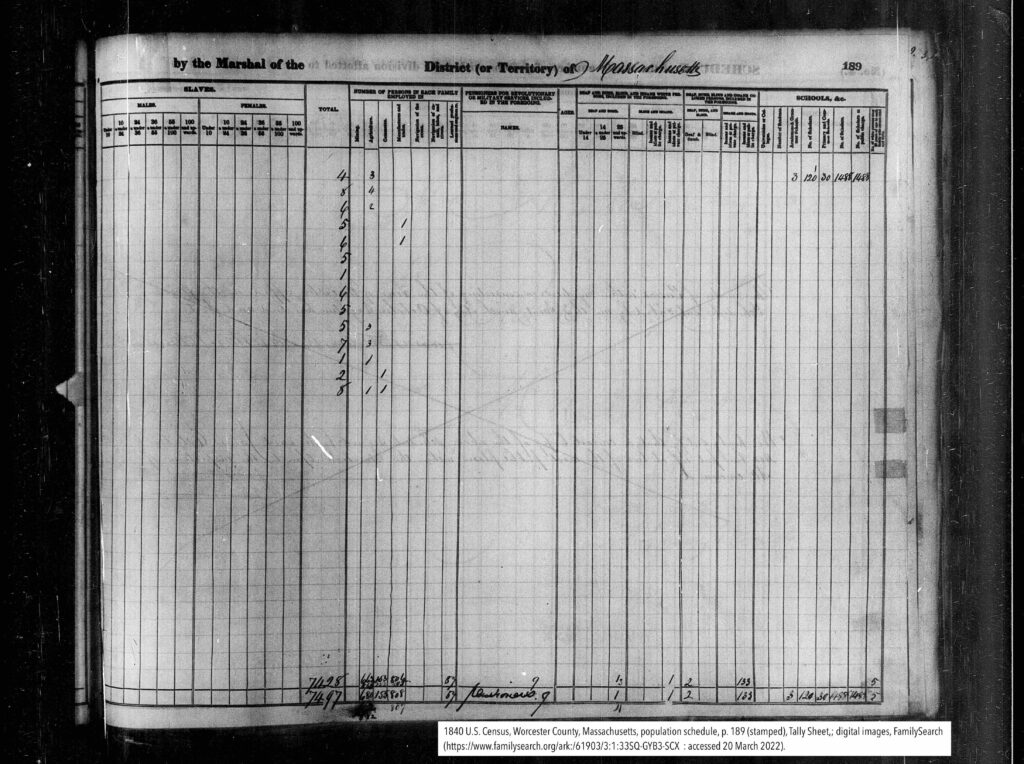
Jarvis determined that the Worcester, Massachusetts enumeration contained a more flagrant error. The totals page, shown below, noted 133 “colored persons” who were insane or idiots and cared for at public expense. The entire “free colored” population shown on the prior page was 150. Dr. Jarvis’ investigation revealed that the 133 people were white residents of the state hospital for the insane.[12]
Jarvis’ analysis became known to members of Congress and on 26 February 1844, John Quincy Adams brought a resolution to the House of Representatives that the “Secretary of State be directed to inform the House whether any gross errors have been discovered in the printed …census…[of 1840]…and, if so, how those errors originated, what they are, and what, if any, measures have been taken to rectify them.”[13] On April 10 1844, John C. Calhoun was appointed Secretary of State and on 6 May 1844, he responded to the House Resolution of 26 February “stating that no such errors had been discovered.”[14] Efforts to address the errors continued for decades, with Jarvis continuing to publish and refute publications that cited the erroneous data.[15]
The 1840 census errors remain.[16] John C. Calhoun used the results of the faulty census to justify slavery to the British government, who had pressured the United States to abolish slavery in Texas.[17] A report in 1900 concluded that errors were present in 1840 and attributed the errors to “ineffectiveness of the machinery by which the census was then taken” including the amount of data being collected, inadequate compensation, and improper supervision.[18] That these errors remain serve as a testament to people who would misuse data to further the ill treatment of other members of society, such as the enslavement of 2,487,355 people counted in the 1840 census.[19] As family historians, our experience with individual errors can help us understand how the magnification of errors combined with nefarious political actions furthered the cause of enslavers and underpins myths that survive to this day.
[1] United States Department of Commerce, U.S. Census Bureau, Measuring America: The Decennial Censuses From 1790 to 2000, Report Number POL/02-MA(RV), September 2002, United States Census (https://www2.census.gov/library/publications/2002/dec/pol_02-ma.pdf : accessed 19 March 2022), p. 5-65.
[2] “The First U.S. Census is Taken,” Jeremy Norman’s HistoryofInformation.com (https://www.historyofinformation.com/detail.php?id=1347 : accessed 20 March 2022).
[3] U.S. Department of Commerce, Measuring America, September 2002, p. 5-7
[4] U.S. Department of Commerce, Measuring America, September 2002, p. 119.
[5] Tammy Hepps, “When Henry Silverstein Got Cold: Fraud in the 1920 Census,” Homestead Hebrews (https://homesteadhebrews.com/articles/when-henry-silverstein-got-cold/ : accessed 25 March 2022).
[6] U.S. Department of Commerce, Measuring America, September 2002, p. 5-65.
[7] Department of State, Compendium of the Enumeration of the Inhabitants and Statistics of the United States, As Obtained at the Department of State, from the Returns of the Sixth Census, (Washington: Thomas Allen, Printer, 1841); digital images, FamilySearch (https://www.familysearch.org/library/books/viewer/195136/ : accessed 19 March 2022).
[8] Edward Jarvis, Insanity among the Coloured Population of the Free States (extracted from the American Journal of the Medical Sciences for January, 1844, (Philadelphia: T.K & P.G. Collins, Printers, 1844), p. 6; digital images, Internet Archive (https://archive.org/details/101475758.nlm.nih.gov : accessed 20 March 2022).
[9] John C. Calhoun, Speeches of John C. Calhoun: Delivered in the Congress of the United States from 1811 to the Present Time, Chapter XIV, “Speech on the Reception of Abolition Petitions, February, 1837,” (New York: Harper & Brothers, 1843), p. 225; digital images, Internet Archive (https://archive.org/details/speechesofjohncc00incalh/page/224/mode/2up : accessed 19 March 2022).
[10] 1840 U.S. Census, Pickens County, South Carolina, population schedule, Pickens District, p. 354 (stamped), John C. Calhoun household, line 12 (hand counted); digital images, FamilySearch (https://www.familysearch.org/ark:/61903/3:1:33S7-9YT5-9L1P and https://www.familysearch.org/ark:/61903/3:1:33SQ-GYT5-9PDH : accessed 20 March 2022).
[11] Robert W. Wood, Memorial of Edward Jarvis, MD, American Statistical Association, (Boston: T.R. Marvin and Son, Printers, 1885), p. 10-12; digital images, GoogleBooks (https://books.google.ca/books?id=amKMsWB1Jy8C : accessed 19 March 2022).
[12] Edward Jarvis, Insanity among the Coloured Population of the Free States (extracted from the American Journal of the Medical Sciences for January, 1844, (Philadelphia: T.K & P.G. Collins, Printers, 1844), p. 7.
[13] “Mr. ADAMS offered the following….,” Congressional Globe, U.S. House of Representatives, 28th Congress, 1st session, p. 323, col. 3; digital image, A Century of Lawmaking for a New Nation: U.S. Congressional Documents and Debates, 177401875, (https://memory.loc.gov/cgi-bin/ampage?collId=llcg&fileName=013/llcg013.db&recNum=346 : accessed 20 March 2022.)
[14] Journal of the House of Representatives, Vol. 39, 6 May 1844; digital images (https://memory.loc.gov/cgi-bin/ampage?collId=llhj&fileName=039/llhj039.db&recNum=876&itemLink=D?hlaw:3:./ : accessed 20 March 2022)
[15] Albert Deutsch, “The First U.S. Census of the Insane (1840) and Its Use as Pro-Slavery Propaganda,” Bulletin of the History of Medicine, Vol. 15 (May 1944), p. 475; digital images JSTOR (https://www.jstor.org/stable/44446305 : accessed 19 March 2022).
[16] Peter Whoriskey, “The bogus U.S. census numbers showing slavery’s ‘wonderful influence’ on the enslaved,” The Washington Post, digital edition,17 October 2020, (https://www.washingtonpost.com/history/2020/10/17/1840-census-slavery-insanity/ : accessed 20 March 2022).
[17] Albert Deutsch, “The First U.S. Census of the Insane (1840) and Its Use as Pro-Slavery Propaganda,” Bulletin of the History of Medicine, Vol. 15 (May 1944), p. 477.
[18]Carroll D. Wright, The History and Growth of the United States Census prepared for the Senate Committee on the Census, (Washington: Government Printing Office, 1900), p. 37; digital images, Census.gov (https://www.census.gov/history/pdf/wright-hunt.pdf : accessed 20 March 2022).
[19] Department of State, Compendium of the Enumeration of the Inhabitants and Statistics of the United States, (Washington: Thomas Allen, Printer, 1841), p. 368.
