In August, FamilySearch added a new feature: the capability to link non-relatives to someone in their Family Tree. The FamilySearch Family Tree is a shared family tree where everyone works on the same tree. WikiTree, one of my favourite genealogy websites, is another.
This feature benefits anyone doing FAN Club research. The FAN Club are a person’s friends, associates, and neighbours. Elizabeth Shown Mills coined the term and it revolutionized genealogical research. One of the best ways to solve documentary genealogical mysteries is to focus on others who interacted with our ancestor. Seeing the same neighbours, witnesses, bondsmen, and chain crews (people involved in surveying property) can help us be sure the person we are researching is the person we are interested in, or help us distinguish two people of the same name. To see another post on FAN Club research see here.
The feature can also associate people linked through slavery. The best effort to do this is the US Black Heritage Project at WikiTree, which I’ve written about here. The WikiTree effort differs from the current “Other Relationships” Feature at FamilySearch because there are standards and project teams working to support the effort. Nevertheless, FamilySearch’s “Other Relationships” Feature will benefit researchers.
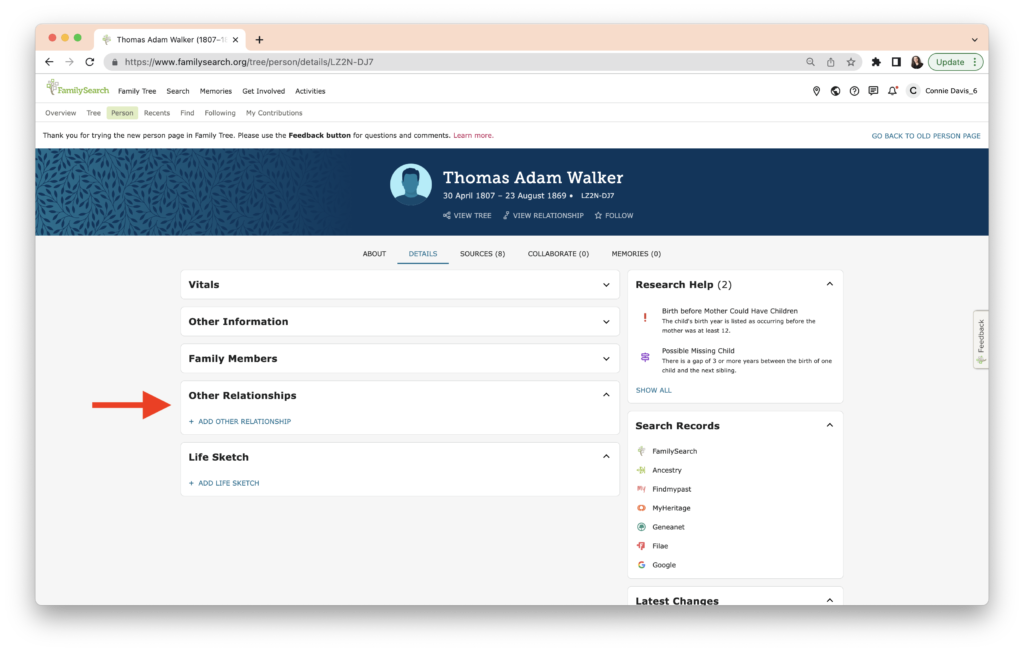
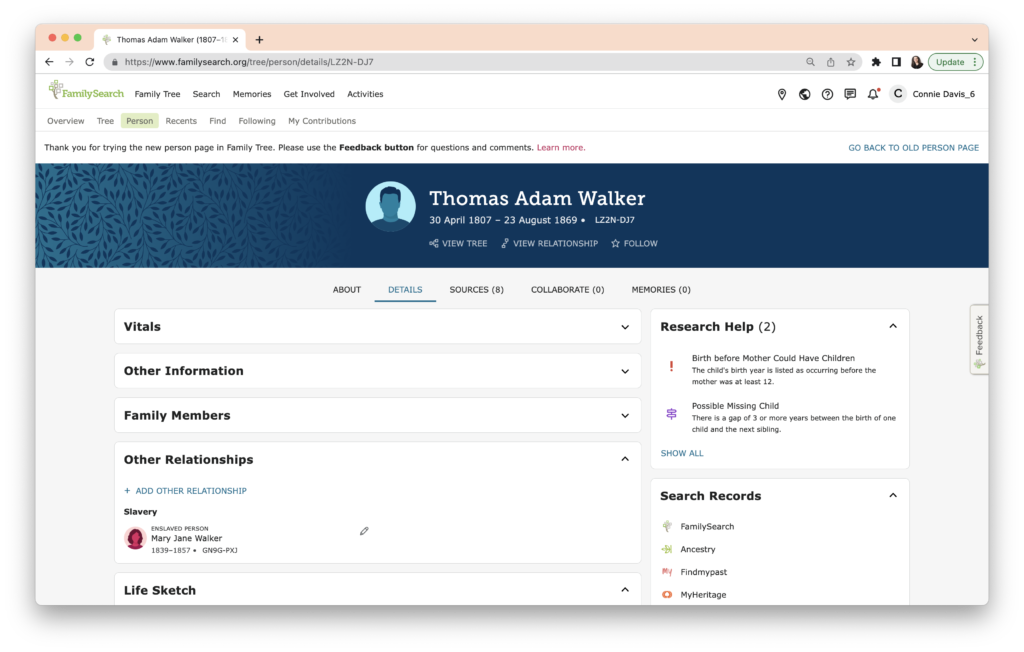
Here’s where you find “Other Relationships.” First you need to be using the “New Person Page.” To find that, click on the upper right “Go to New Person Page” when viewing any person in the FamilySearch Family Tree as shown below. I’m using my 3x great-grandfather, Thomas Adam Walker, as an example.
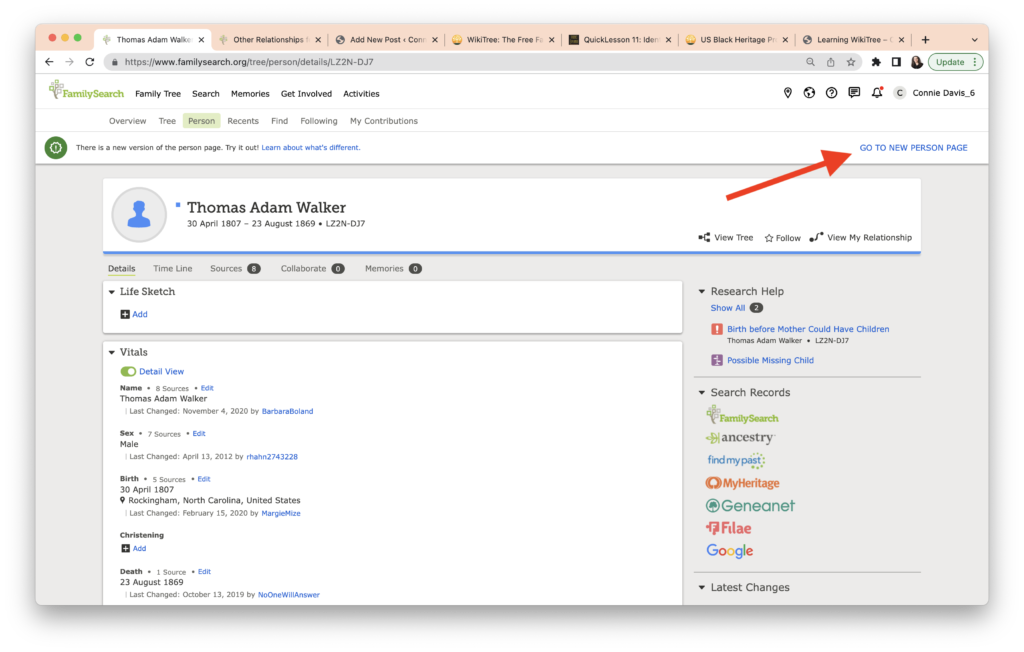
The New Person Page features a new banner, is organized differently, and provides easier navigation. In the view below, I’ve collapsed the sections so that the “Other Relationships” is visible (red arrow).
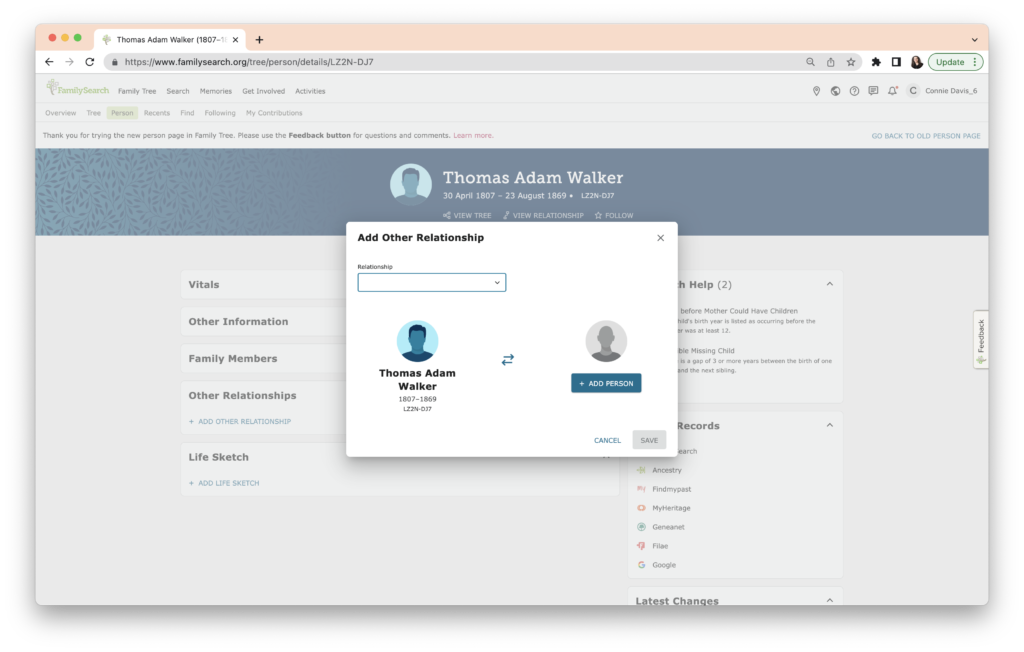
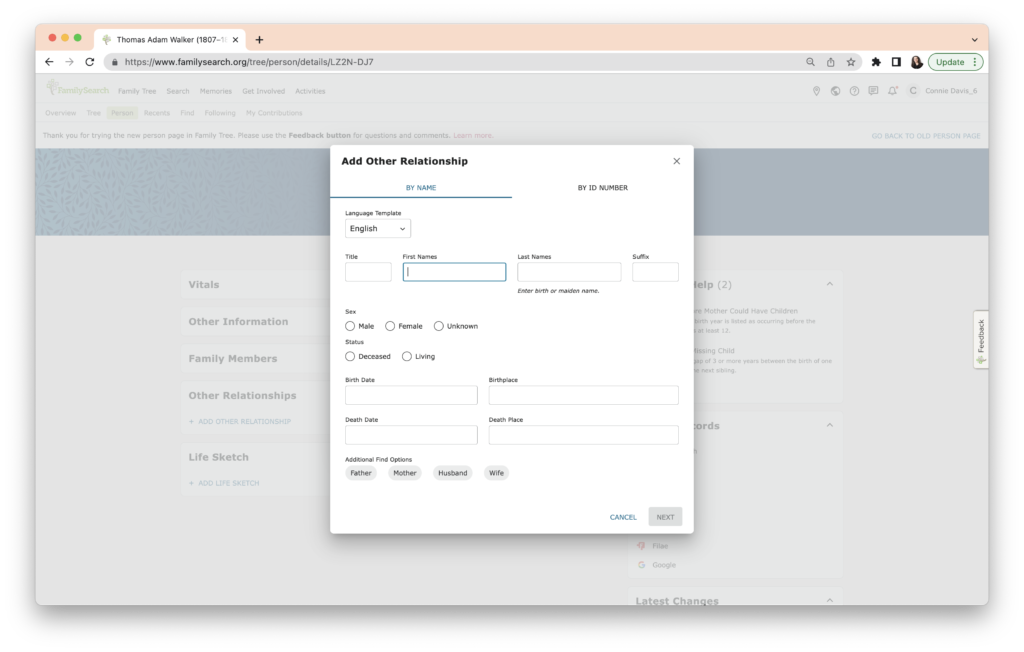
When you click on “Add Other Relationship,” a dialogue box appears.
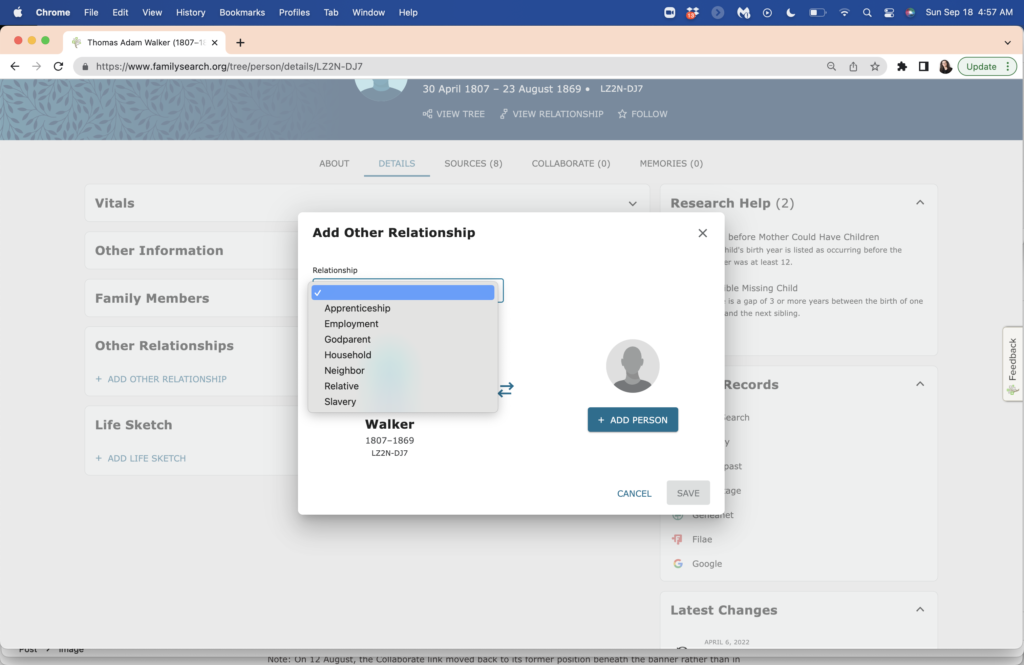
Clicking the “Relationship” drop-down menu provides the following choices, shown below: apprenticeship, employment, godparent, household, neighbor, relative, slavery.
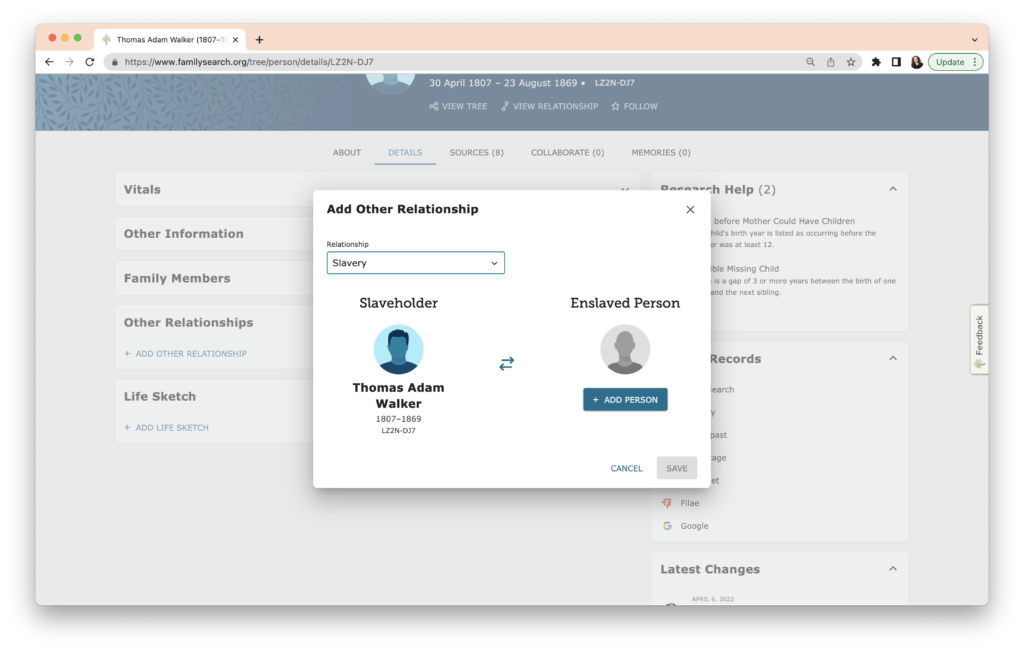
My ancestor was an enslaver, so I wanted to add a slavery relationship. (I’ve already done this on WikiTree, which has a more robust system to describe relationships and categories. I decided to put it on the FamilySearch Family Tree because many people use it for their research. Thomas Walker’s WikiTree profile with the link to Mary Jane is here. ) When I choose “Slavery” from the drop-down menu, I see the the linkage shown in a diagram, below.
When I click on “Save” at the bottom right, I get a new dialogue box and I can either add a new person, or use the FamilySearch Family Tree unique identifier to link to them. Since Mary Jane doesn’t seem to be on the Family Tree (and I don’t know if she survived to emancipation, or the surname she used after emancipation if she lived); I will enter her as a new person. She can be merged later if a duplicate entry in the Family Tree is found.
The next step is to enter what I know about Mary Jane, which isn’t a lot. It is enough to help someone who might be searching for her.
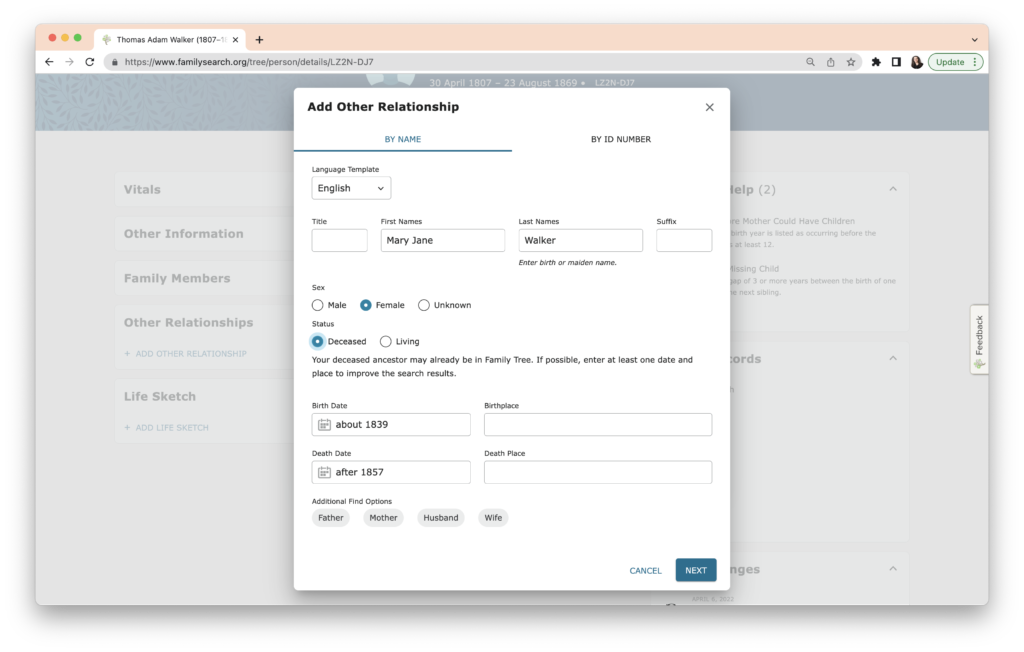
I’ve filled in the details I know below. I used Walker as her last name. WikiTree has the ability to provide multiple last names, which is another reason to make sure this information is on WikiTree. I decided to not guess that she was born or died in Tennessee, which is likely.
When I click “Next,” FamilySearch has checked their database and found someone with a similar name and dates.
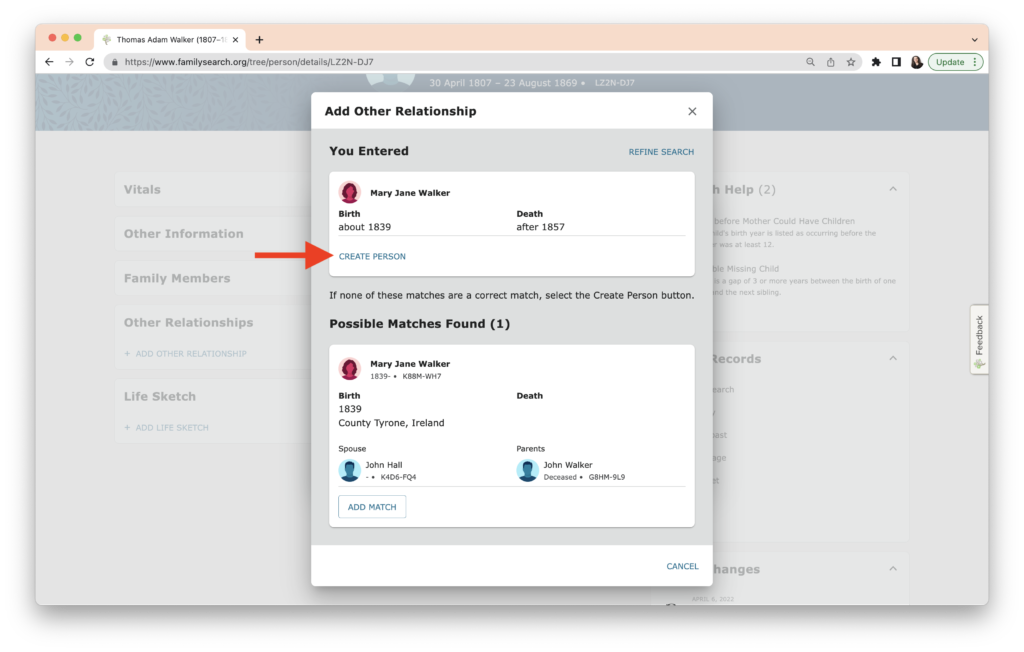
Since I’m sure Mary Jane was not born in Ireland and I know Walker is a provisional last name, I click “Create Person” as shown by the red arrow. Another box comes up, providing me an opportunity to make sure I have the linkage done properly, showing Thomas Adam Walker as the “Slaveholder” and Mary Jane Walker as the “Enslaved Person.” (Perhaps FamilySearch will reconsider their terms at some point. Slave Holder doesn’t begin to convey the nature of this relationship. “Enslaver” would be a better term. I acknowledge they may be using this term to allow search engines to find this information. Our terms will continue to evolve over time. WikiTree has an explanation about terminology, and why they use the terms they have chosen here.)
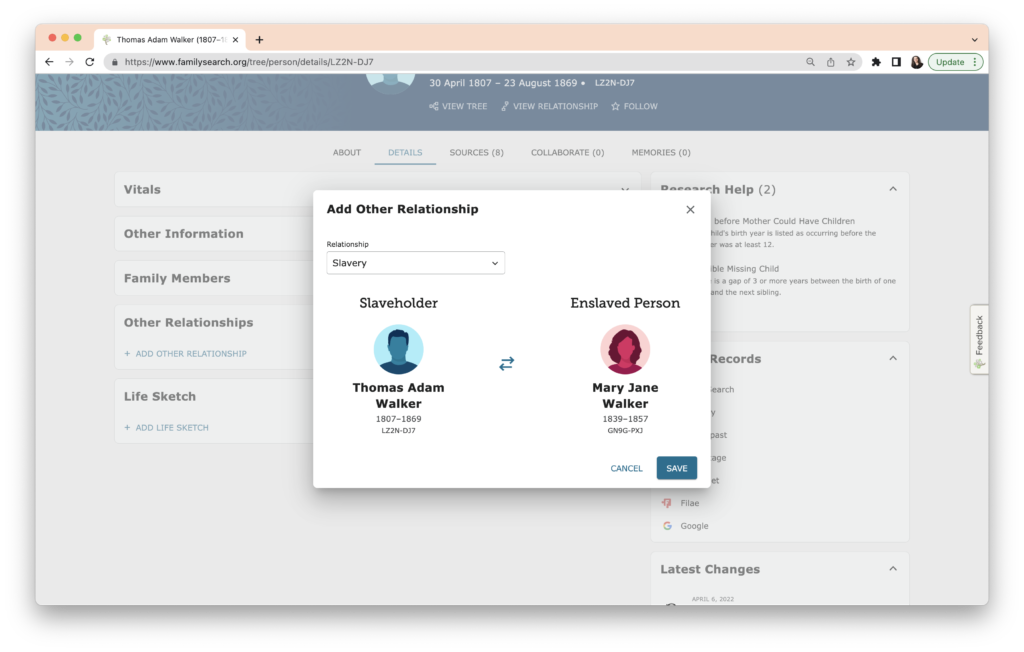
When I click “Save” in the lower right of the dialog box, I am taken back to Thomas Waker’s profile and I can now see the relationship to Mary Jane.
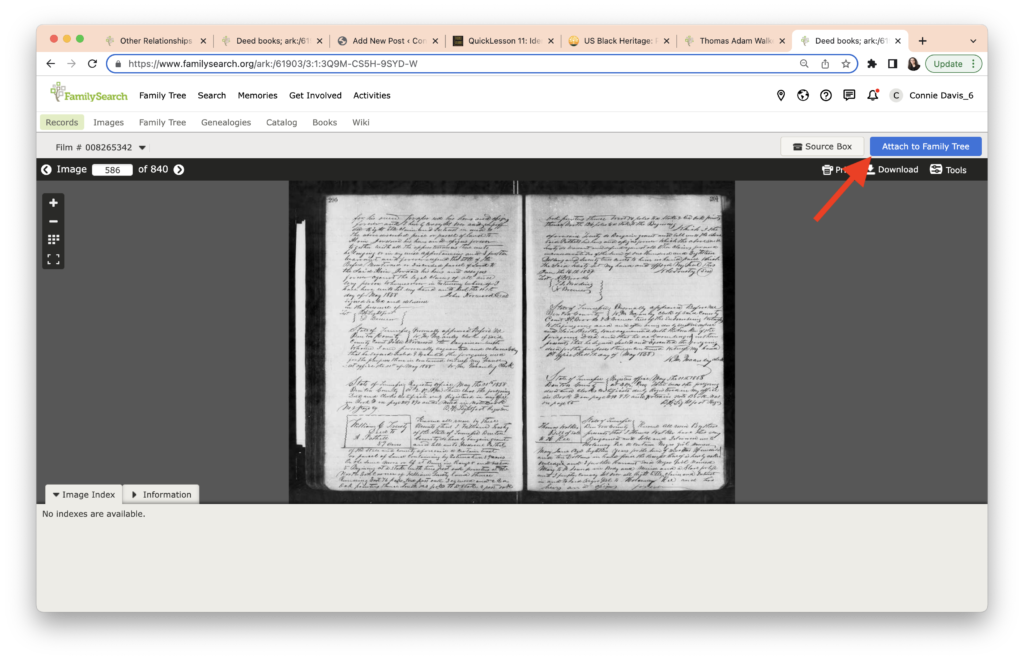
I haven’t been asked to add a source at any time, so I need to do that. The Bill of Sale between Thomas Walker and Holloway Key, another of my 3x great-grandfathers, is on FamilySearch, so I navigate to the document. The “Attach to Family Tree” button in the upper right is what I need.
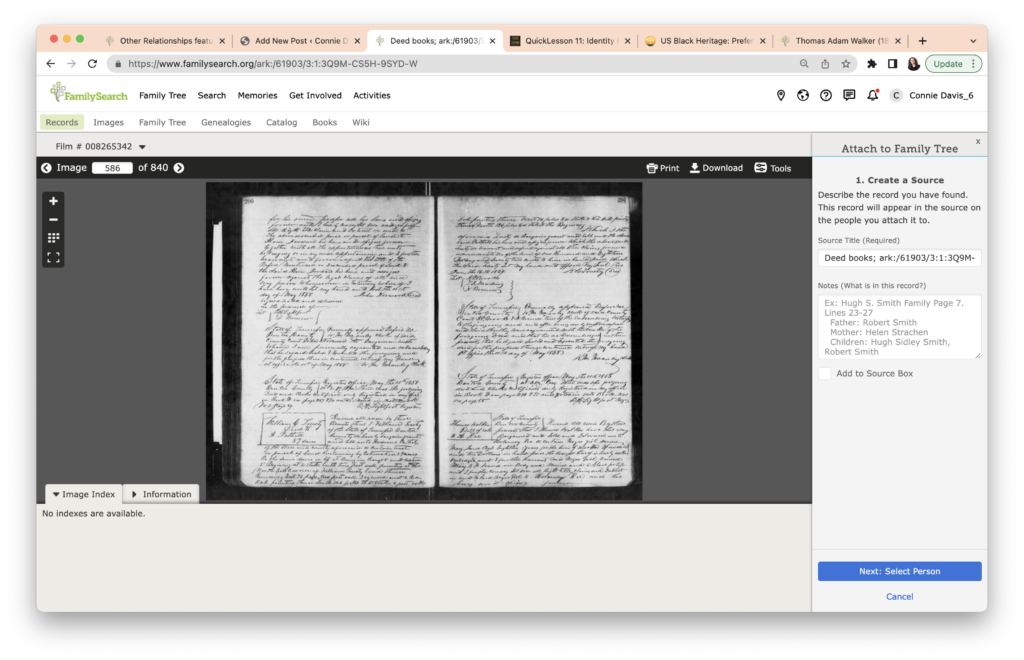
This opens a bar on the right.
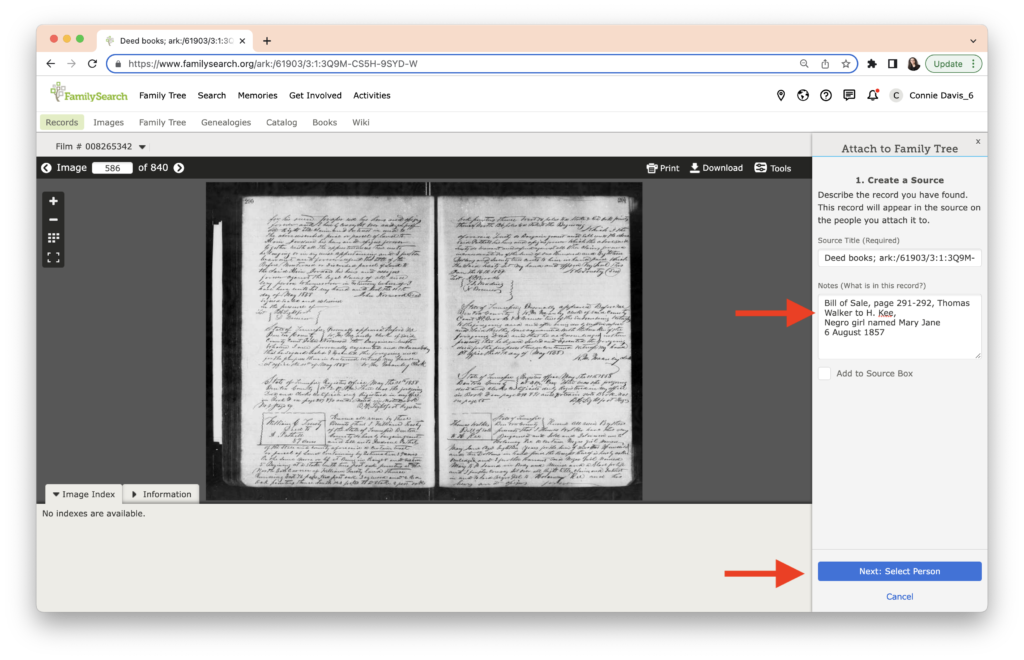
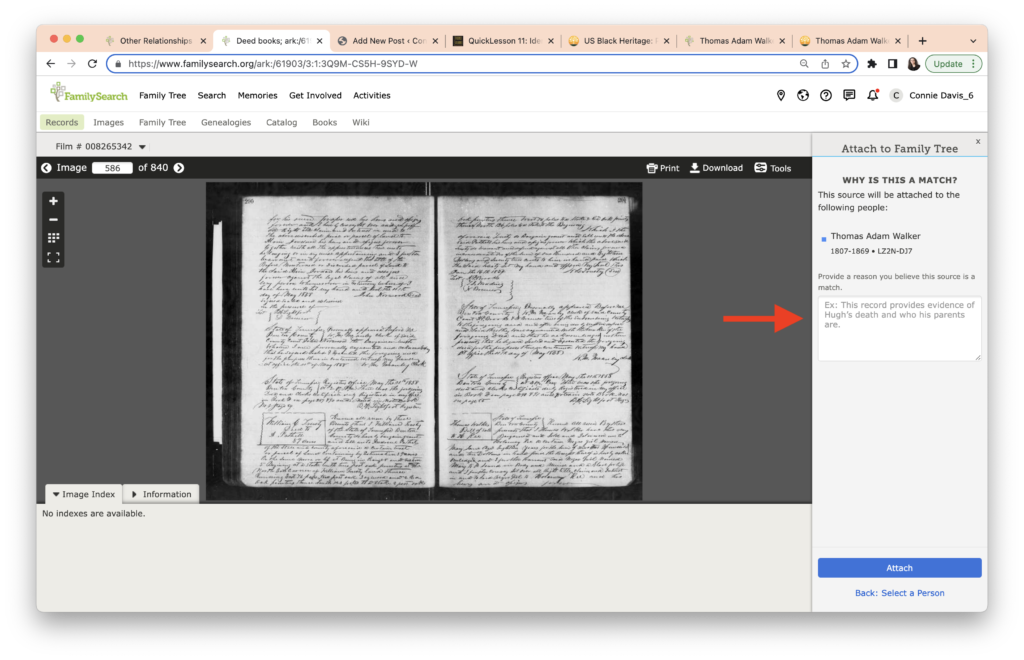
I next add in some details about how this record is linked to Thomas Walker, as shown in the upper red arrow in the image below. When I’m satisfied, I click the blue button to choose the person in the FamilySearch Family Tree that I want to add this record to.
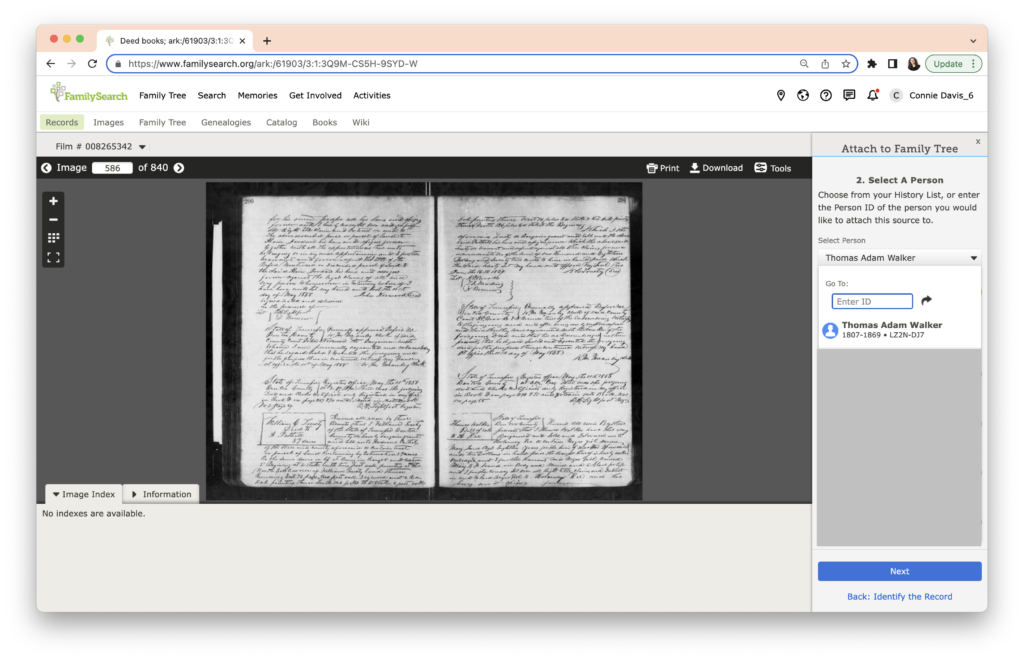
FamilySearch then asks me to enter the person’s ID (their unique identifying number, which appears near their name on their page) or if I’ve been working in FamilySearch, I will see a list of people below. Note: I’ve placed a grey box over the rest of the list to preserve the privacy of clients I am currently working with.
I’m almost done. FamilySearch asks me to check my work and asks for an explanation next to the red arrow. This is an important step. Linkages form the foundation for genealogy.
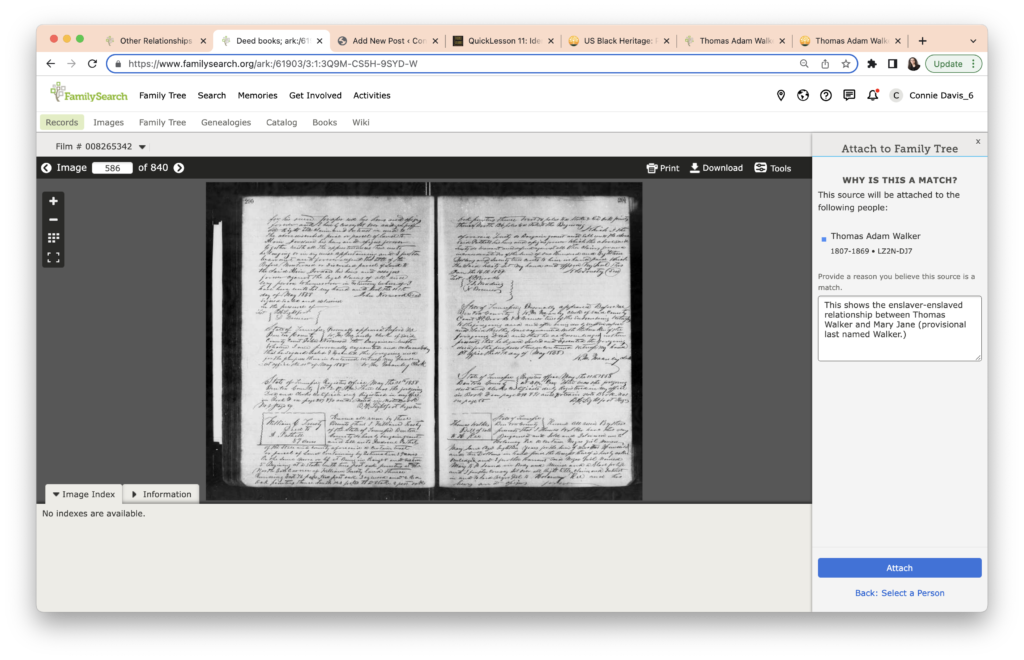
I write about the enslaver-enslaved relationship in the box provided.
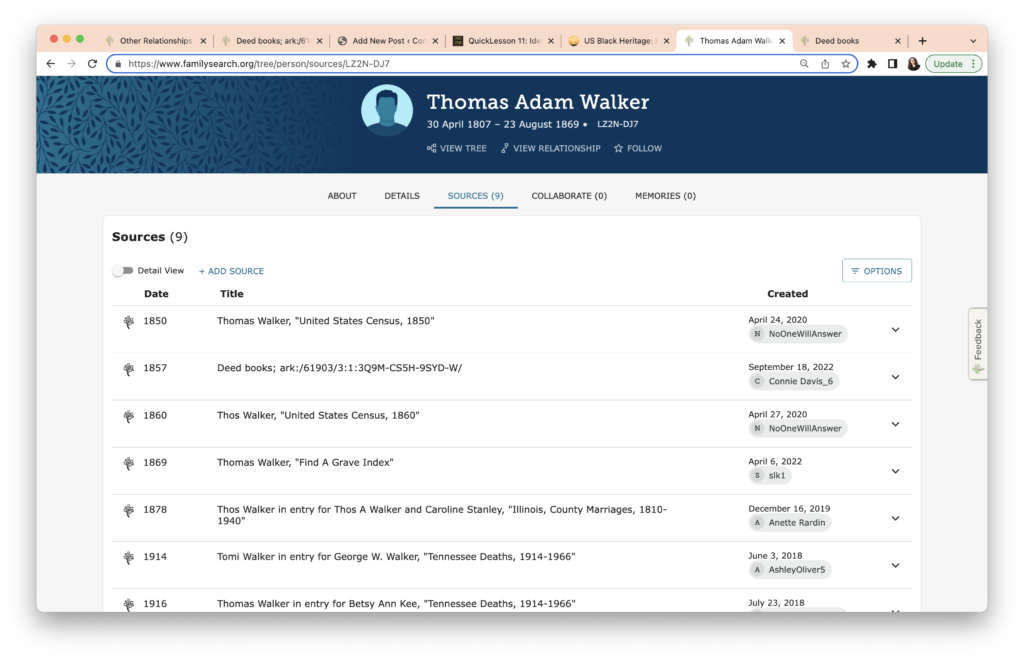
I like to check my work, so I go back to Thomas Walker’s profile and check the Sources list. The date for the Bill of Sale is missing! It doesn’t show up in order in the Sources list.
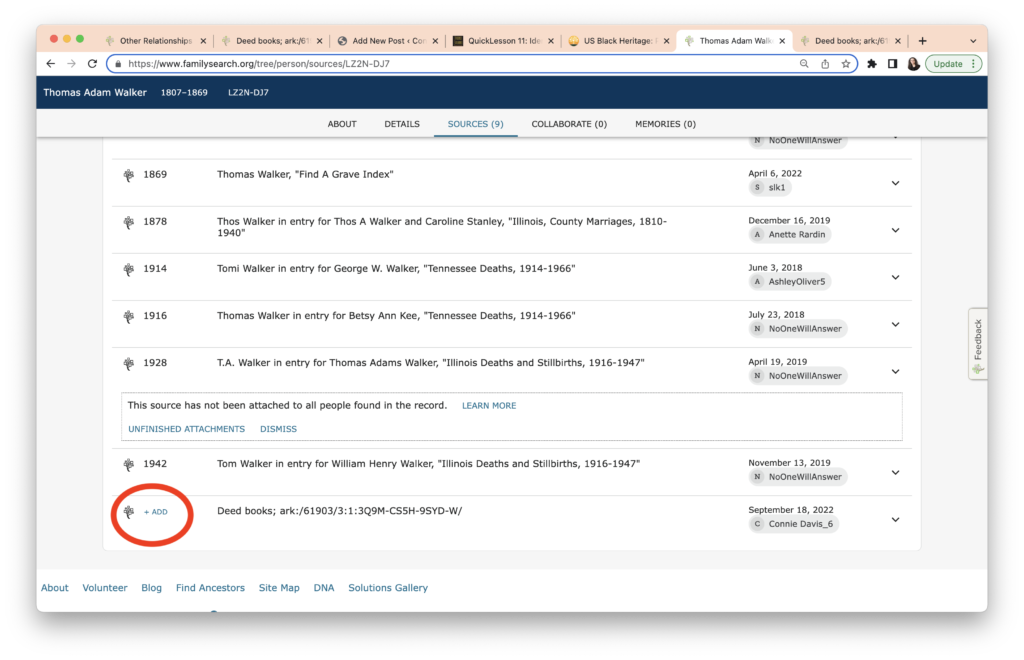
This is a quick fix. I click on “Add” (circled above) and a dialog box appears.
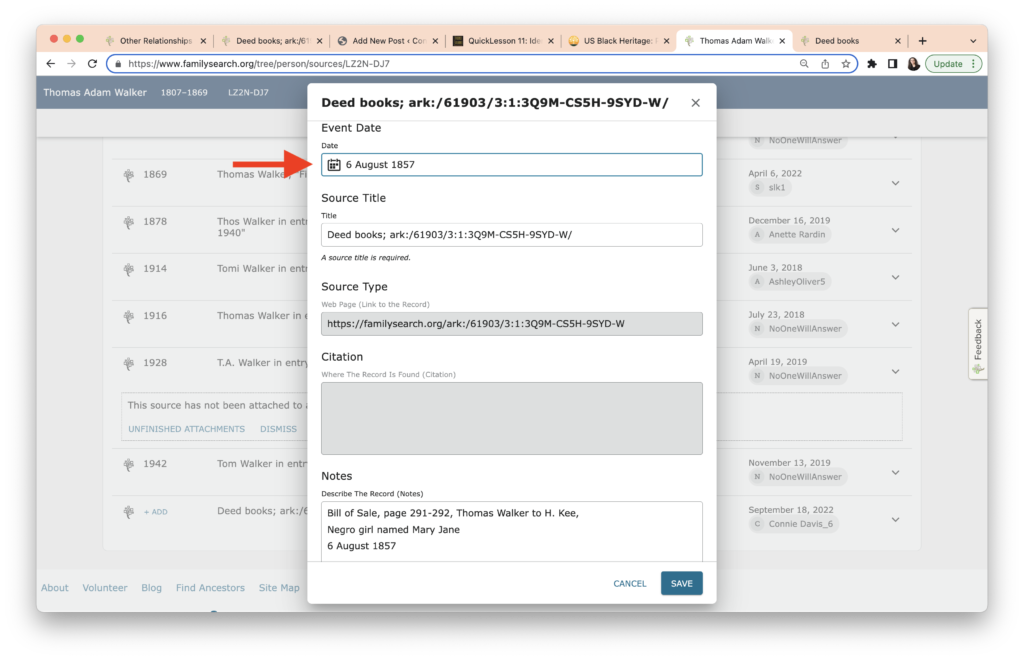
I add the date and recheck. It’s now in the right place.
My final task is to add this document to Mary Jane. Since she is linked on Thomas Walker’s page, I can repeat the above process for Mary Jane to create a source, and on Holloway Kee’s page, I can add the “Other Relationship” along with the source. It’s much faster the second time since I have a model to follow.
The result is that Mary Jane now has a Page on the FamilySearch Family Tree, shown below.
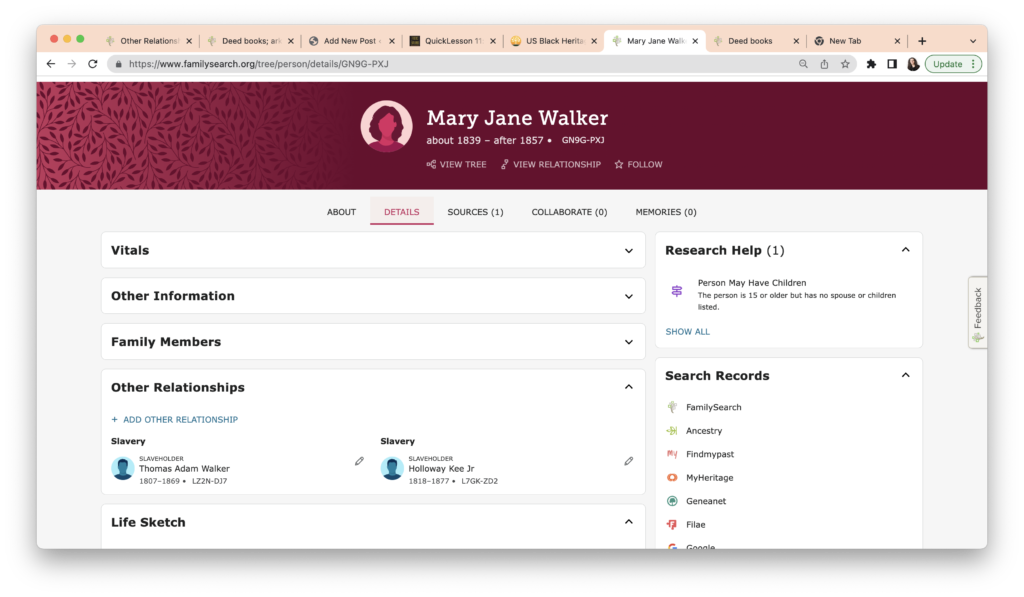
This is a great step for FamilySearch and will help researchers in many ways. The functionality on WikiTree US Black Heritage is superior. For example, the category search that would allow anyone looking for an enslaved person in Benton County to find Mary Jane. A person could also search the Benton County Tennessee Slave Owners (see note about terminology above.). The ability to give her multiple provisional surnames also aids any researchers looking for Mary Jane.
Thanks FamilySearch, for adding this feature!