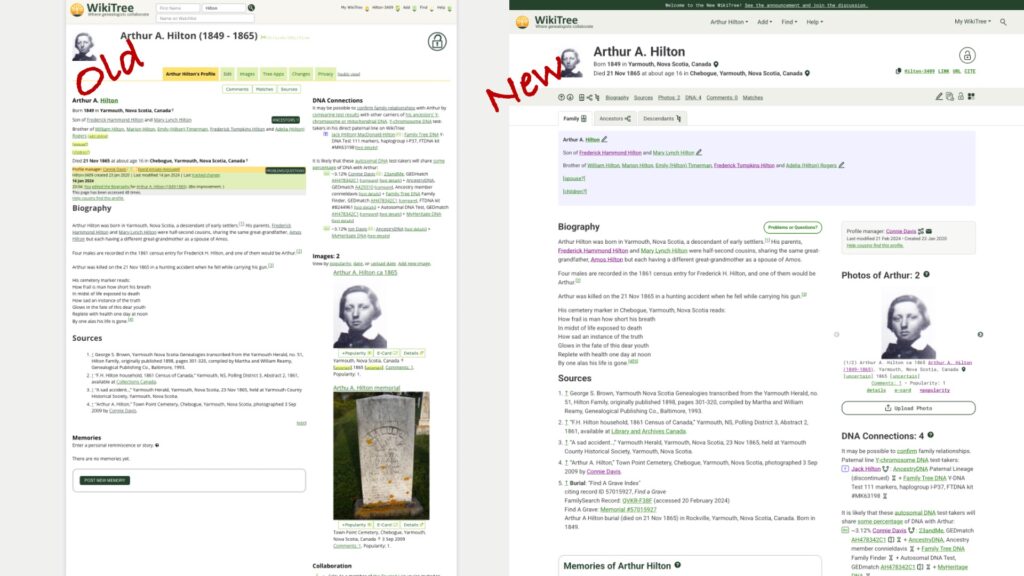
Over the past year, a team of paid consultants and volunteer developers at WikiTree created an updated look for WikiTree. WikiTree, the free, one-world tree, is the place I share my best genealogical research. Check out my profile to see how active I am on WikiTree. I joined in 2017 and since then I have edited hundreds of profiles, created Free Space Pages, and I manage over 350 profiles. I’ve used the old system and the new one to edit and create profiles and Free Space Pages. I’m very familiar with WikiTree, including its strengths and shortcomings.
WikiTree is a publicly available website and far more likely to outlast me than any other place my research resides. WikiTree is not known for flash. After all, without income from memberships (WikiTree is financed by unobtrusive ads that are only shown to non-members or members who are not logged in), WikiTree lacks the budget power of Ancestry, MyHeritage, or software companies. They have done an amazing job with the redesign.
Let’s take a look at some of the updates on the profile of Arthur Hilton. I’m his two-times-great grand-niece. He died young, and he’s one of the people I honour at WikiTree.
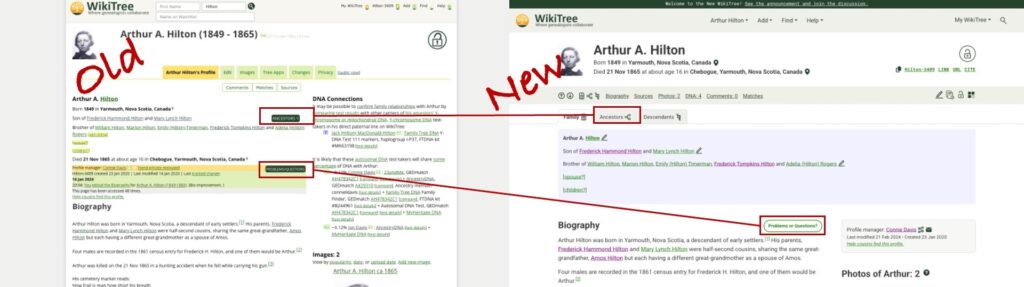
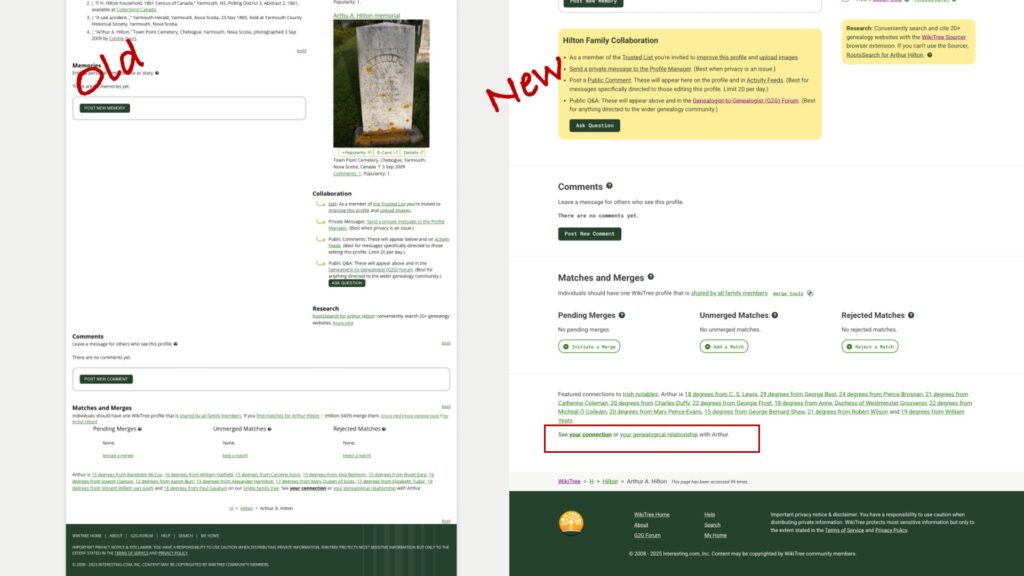
Side-by-side comparison of old and new
The overall look is cleaner and better organized. The huge grey border (a total waste of space) is gone and there’s a better balance between the two columns. The larger font is easier to read and the use of colour makes sense. See that blue box? It’s a visual cue that I’m looking at the profile of a biological male. The hypertext is green and links you have clicked are purple.
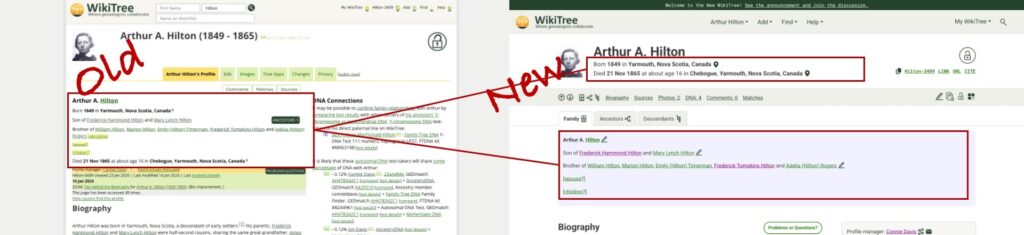
Wiki ID and menus
The area for the WikiTree ID and dropdown menus has been streamlined and cleaned up. The menus are more visible with the larger font and the menus themselves contain less clutter. (The menus are not shown here! Click on one and check them out!)
Copyable text options
The visibility of useful copyable text options is perfect! In the old version, they were almost invisible in tiny green font. They are now clearly marked with a new copy icon, familiar from other websites. I use these links when sharing profiles in emails, adding links within profiles, and in my research logs. And if you like to cite WikiTree, you can do that here with one click.
Menu placement and improved icons
Like all good websites, there’s usually more than one way to navigate. This menu in grey background is a redesigned tab menu. It uses icons and text to move commonly used features and actions together. The more experienced WikiTree user wants to access profiles and features quickly without scrolling, and here they are. I’m referring to this as the “Quick Menu.” Well done, design team! I love the simple navigation arrows and ability to jump to the part of the profile I want to see, (including the ancestors and descendants tabs), the “edit” pencil, the profile change history icon, familiar privacy icon (padlock), and the new Tree apps icon.
Key details and relationships
Information that was small and difficult to parse is now separated with better placement in the profile. Key details (birth and death with locations and certainty indicators) now appears immediately below the larger, improved name block. Relationship information is in the shaded block, blue for Arthur, a biological male.
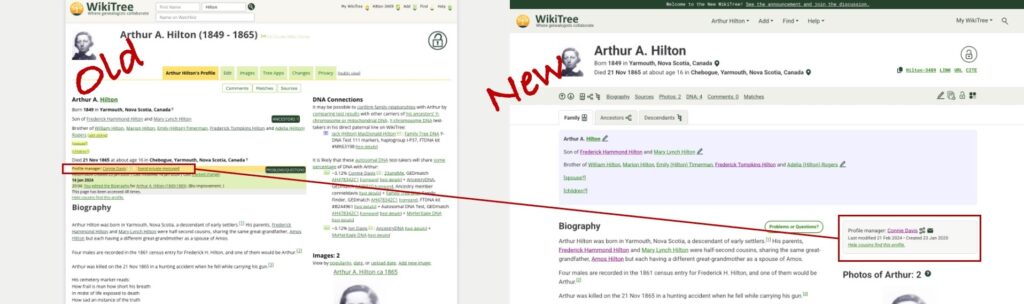
Finding the profile manager is also easier.
The new profile manager section
The profile manager formerly appeared in small font in the crowded area on the left. It now has its own shaded block on the right. In addition to allowing an instant email to the profile manager, there is now a redesigned “connections” icon which allows you to see how the profile manager is connected to the profile. In the past, I needed to go to another part of WikiTree to see this information. Now when I contact a profile manager, I may gain insight of their motivation to create or manage the profile.
The next improvement may be lost on many WikiTreer users.
Better placement of Ancestors and Problems/Questions buttons
As part of the Ambassador team at WikiTree and someone who is often demonstrating WikiTree, I appreciate that the Ancestors Button and Problems/Questions buttons are no longer in a similar position with the same design. Note: There would be a descendants button on the “old” version if Arthur had descendants. The new design allows the user to access ancestors or descendants using the icon in the grey Quick Menu bar or using the clearly visible tab.
New Ancestor View
Either option opens a family tree for Arthur, also with an improved look and feel. It features separated colour blocks, cleaner font and icons, and arrows to navigate further back in the tree. The Descendants view has similar improvements.
Back on the profile page, it’s time to look at the treatment of DNA in the new profile.
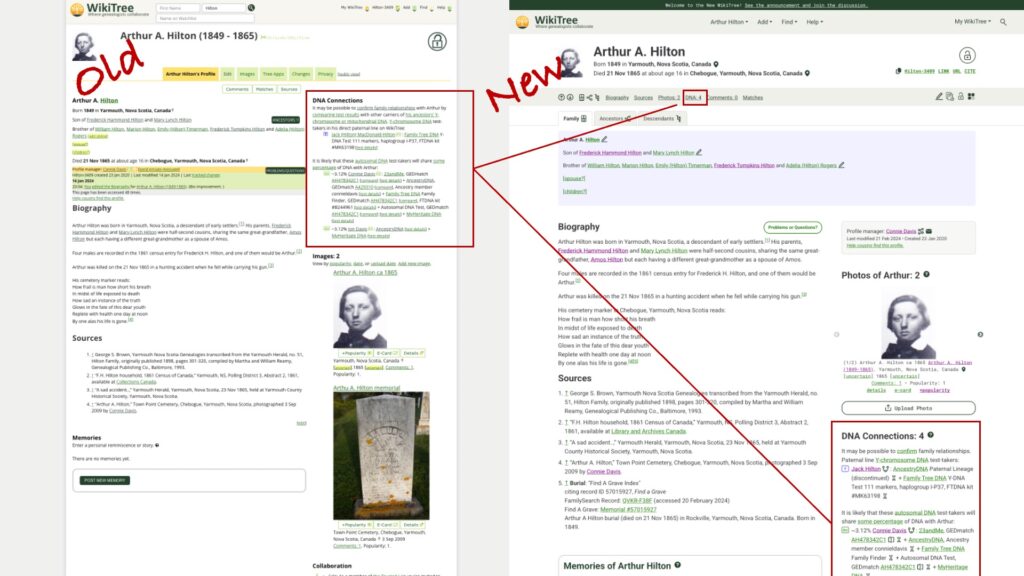
DNA Connections
DNA Connections can now be accessed via the Quick Menu in grey and is found in a familiar location along the right, now below a redesigned photo section. Again, the text block is cleaner, easier to read, and only contains the information it needs to contain.
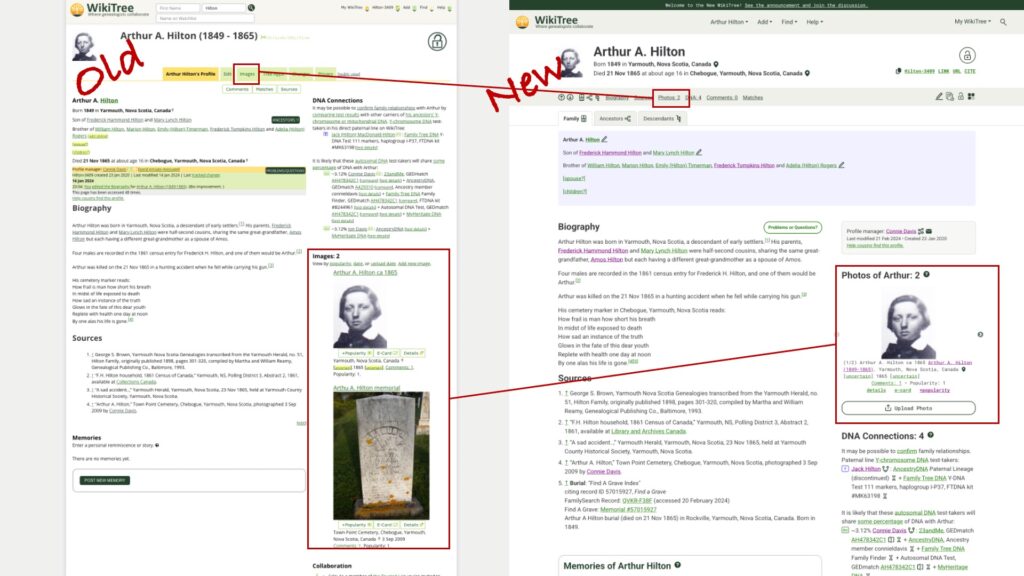
Images are now Photos
The old images block sometimes made a simple profile like Arthur’s lopsided, with the photos dominating the right side. A new photo block allows you to toggle through the uploaded images using a navigation arrow to the side of each photo. You can also navigate quickly to the “Upload Photos” page, which has also received an update and is cleaner and easier to use. Again, kudos to the Design Team and programmers. They went over this website with a fine-toothed comb!
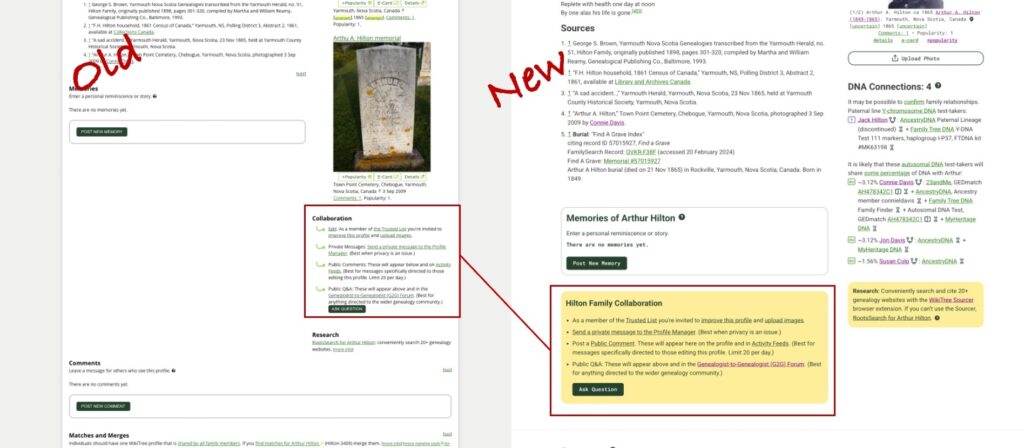
Collaboration stands out
In the past, the use of yellow background wasn’t clear to me. Now yellow highlights collaboration and ongoing research. The collaboration language is friendly and clear. The research block encourages people to check out the incredibly useful WikiTree Sourcer Extension (which works great with the new updates.)
Comments, Matches and Merges, and useful Connection and Relationship Information
Scrolling down, you can see how the new design makes better use of space – there is not a huge empty block to the left. In profiles with a longer biography, there will be blank space to the smaller right side of the page. The Comments and Match and Merge sections have gotten the cleaner, pithier treatment, and thankfully, the text with “See your connection or your genealogical relationship with Arthur” is now separated from the Featured Connections text.
Even the footer is now easier to read and more pleasing to the eye.
I know this is a tiny glimpse of all that was accomplished with this redesign, and there’s much more I haven’t noticed yet. I look forward to finding the features I’ve missed, and new features that may replace what I’ve shown here.
Well done, WikiTree!
And if you’re new to WikiTree, welcome! Check out the Help links on WikiTree and useful information at the WikiTree YouTube channel.
Several times a year I am asked about a small segment match. For the purposes of this blog, I am considering anything below 8 centimorgans (cM) a small segment.
Many experienced and eloquent genetic genealogists have written on this topic. The titles of their articles include a spoiler alert:
To understand why small segments are deceptive, it’s important to understand how DNA matching is measured. When you look at a DNA match list at any company, you will see the shared cM amount between you and your match. But that’s not all they use to determine if you are a match. Each company has a threshold for sharing which incorporates shared cMs and other characteristics of the DNA data. This may include matching on one or both chromosomes (remember you get one from each parent), the SNP density (referring to how rich the genetic information is – a very complex topic I don’t pretend to understand), the number of segments you share, and endogamy. Endogamy is the situation where groups of people, often geographically or culturally isolated, partnered with each other over hundreds or thousands of years. The result is that you can have many relationships with your matches, which inflates the amount of shared DNA. If you come from an endogamous population, you need to share more DNA in larger segments to be considered a DNA match. The ISOGG wiki has a table that compares the DNA testing companies matching criteria in detail. Search for “Criteria for matching segments” in the ISOGG Wiki link.
In genetic genealogy, we create images of shared cMs that make measuring DNA look like a simple thing you could do with a ruler, with coloured bars indicating shared segments of DNA. In the image below, I’ve used DNA Painter, importing data from known paternal DNA matches in the blue shaded portion near the top of the image and known maternal matches in the pink section in the lower part of the image. Each different coloured bar represents a different shared ancestor.
A public version of my chromosome painting from DNA Painter
The most basic definition of shared cM dances around the issue of what is actually being measured:
cM: “a unit of measure for autosomal DNA segments. The more DNA we share with someone in centimorgans, the more closely related we are.” Leah Larkin PhD
These simple images and definitions cover up the wealth of science behind what is actually being measured. The ISOGG Wiki provides the following definition for centimorgan:
A centimorgan…is a unit of recombinant frequency which is used to measure genetic distance. It is often used to imply distance along a chromosome, and takes into account how often recombination occurs in a region. A region with few cMs undergoes relatively less recombination. The number of base pairs to which it corresponds varies widely across the genome (different regions of a chromosome have different propensities towards crossover). One centiMorgan corresponds to about 1 million base pairs in humans on average. The centiMorgan is equal to a 1% chance that a marker at one genetic locus on a chromosome will be separated from a marker at a second locus due to crossing over in a single generation.
Whoa! This definition reminds me that I will never understand everything there is about genetic genealogy, and that there are scientists who developed the strategies the DNA testing companies use. Blaine Bettinger has summarized company information on segments and matching here. I have to keep reminding myself that cM measurement isn’t like the length of ribbon, it’s about how likely it is that the DNA will split apart when an egg or sperm is being made.
False matching
Even with all of this science, a match on your match list at a DNA testing company might not be real. How can that be?
That small segment might be a pseudosegment, a false segment which leads to false matches. This can happen because the DNA company takes your DNA apart into the two chromosomes and puts it back together again. Sometimes it is put back together wrong, weaving back and forth between the father’s and mother’s DNA. The smaller the segment, the greater the chance it is a pseudosegment. (For more information and an illustration, see Identical By Descent in the ISOGG Wiki.)
If you have transferred your DNA to another testing company in the past (FamilyTreeDNA and MyHeritage used to allow DNA transfers) or you are using the third-party site, GEDmatch, your small segment might be due to imputation or be from a known pile-up region.
Imputation. Whenever anyone does a DNA test, there are some regions that can’t be read (“no-calls”) and those sections are estimated (imputed). This happens at every DNA testing company. If a DNA company has changed their testing chip over the years they use imputation to allow them to analyze the DNA in the sections of the chip that differ. For companies that accept transfers and GEDmatch, there will always be imputation because of the number of different chips they are analyzing and comparing to each other. Every company does imputation using the methods their scientists have developed. Imputation can create a small segment and it can also separate a larger segment into two segments. Roberta Estes has a three part series in her blog on imputation starting here.
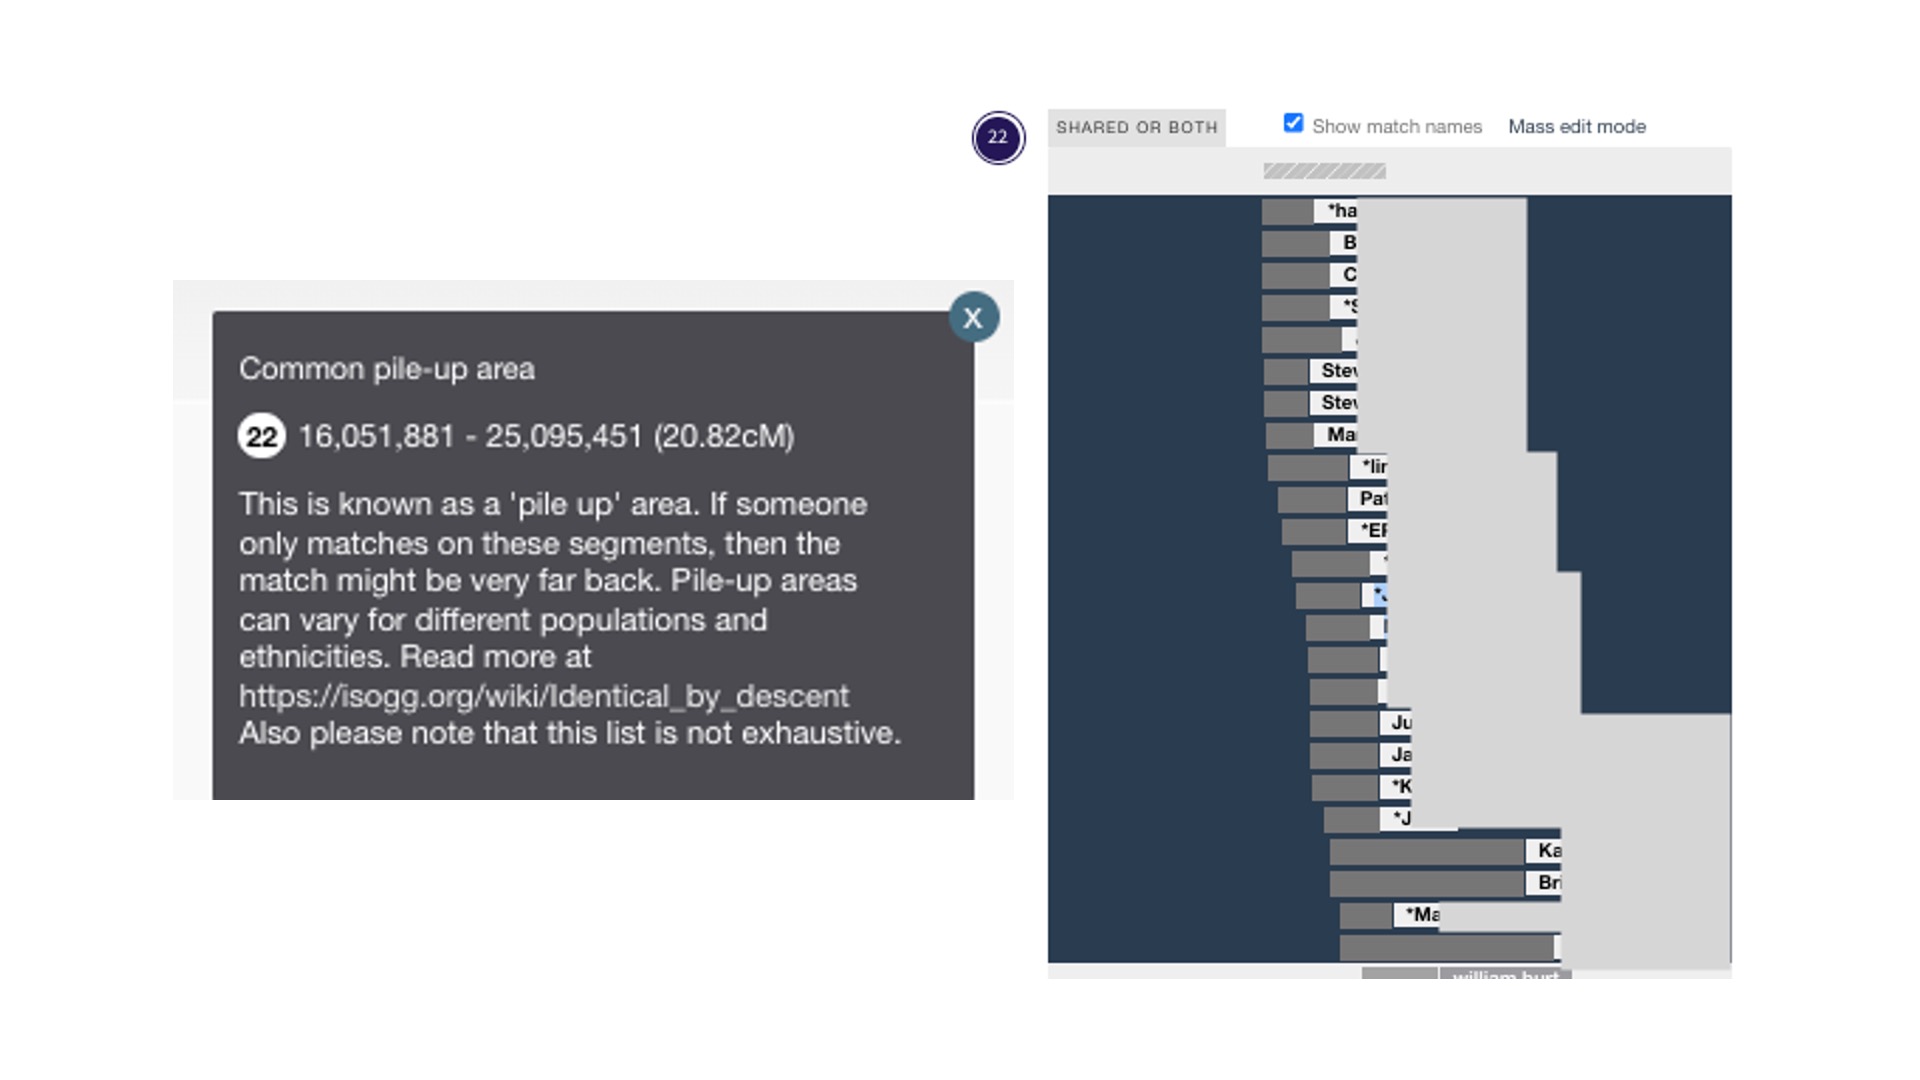
There are pile-up regions where many people have the same DNA. These are also called excess IBD (Identical by Descent). Testing companies don’t report those regions (they have algorithms that leave them out of DNA matching), but GEDmatch reports these regions. More on that in the ISOGG Wiki. Jonny Perl has included the known pile-up areas in DNA Painter; a grey bar with horizontal stripes appears above each chromosome where they are known to happen. In the image above of chromosome 1, you can see the grey bar in the middle above the blue-shaded area. When you click on the grey bar, you will find additional information about that pile-up region. I’ve provided a close-up below of a pile-up region for Chromosome 22. The explanatory text box is on the left. The painting on the right shows data from GEDmatch. In 2023, I shared DNA in this pile-up region with 75 people. I know it’s a pile-up area because there are so many matches and I can see the grey bar with the diagonal stripes at the top. I don’t consider these DNA matches even though they share 10-14 cM with me on that chromosome.
DNA Painter notation about a pile-up area on Chromosome 22 and an example of my match data from GEDmatch
Two additional complications with small segments
Many people do DNA testing to learn more about their country or region origin. Some companies call this ethnicity results. The best term for this kind of data is biogeographical ancestry – where your distant ancestors were at a point in time. That information is also in our chromosomes. That’s complication number one. Your small segment could be Identical by Population, as described by Roberta Estes. Everyone or almost everyone who descends from people on the same migratory population path for thousands of years has the same segment of DNA.
Complication number two pertains to your goal. Many of us do DNA testing because we want to find our ancestors and give them names. We can do that if our matches occur within a genealogical time frame, defined as the time when their might be documents to help us. Your small segment could be from an ancestor not within a genealogical time frame. Using simulated DNA data, Leah Larkin has found a 10 cm match could be a 9th cousin, meaning you share 8x great-grandparents. For most of us, this is at the edge of documentary genealogy. A smaller segment, such as 7 cM could be from a 10th great-grandparent or a 40th great-grandparent or there is a 58% chance it is false. (Simulated data from Leah Larkin. Data on false segment size is from Tim Jantzen in the ISOGG Wiki. See Blaine Bettinger for company specific information on false segment sizes. )
At the third party DNA site, GEDmatch, you can alter the matching thresholds to below what the testing companies are doing. This is where the danger lies. Just because you can set a lower threshold doesn’t mean you should.
But I match someone with a LOT of small segments!
If all of the segments are small, the most likely explanation is endogamy. As mentioned earlier, the strategy for working with endogamous communities is to use larger segments and avoid the small ones. If you are working with an endogamous community, you will be applying different strategies to analyze your DNA. Paul Woodbury has a two part series Dealing with Endogamy. He also lectures and teaches courses. You can seek out presentations and courses by Dr. Adina Newman. Diahan Southard offers an Endogamy Course (full disclosure, I work for Diahan Southard as a coach). Leah Larkin, the DNA Geek, periodically offers an Endogamy lecture and writes about Endogamy in her blog. I recommend all of these from personal experience.
A rational approach to using segment data
With documentary genealogy, we know we need to start with the present and work our way back. You can do the same thing in genetic genealogy using segment data. Jim Bartlett, author of the blog segment-ology, calls this “walking the segment back.”
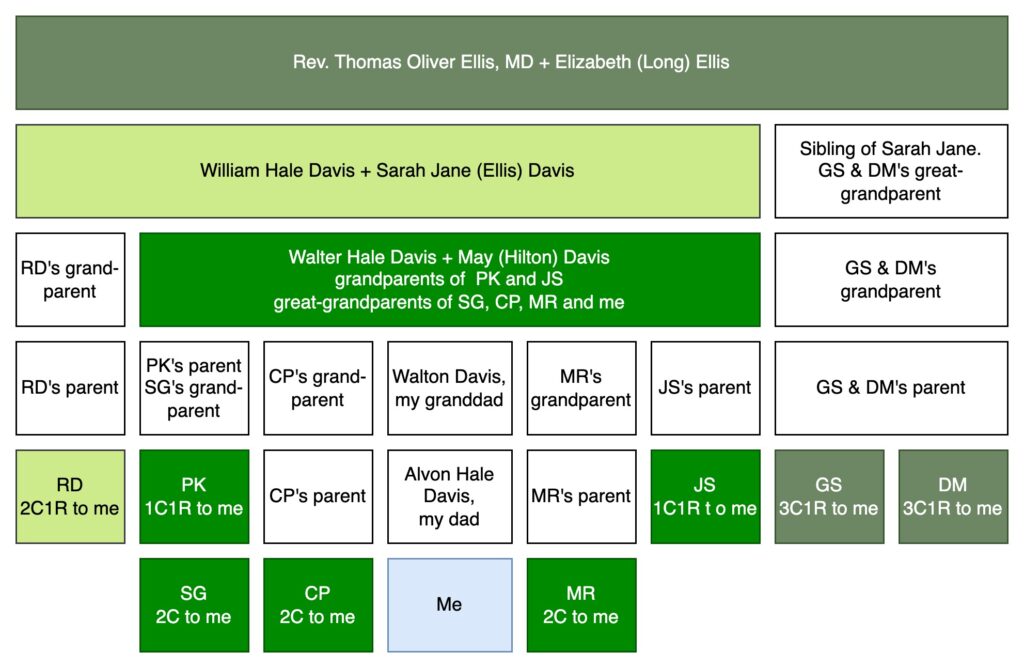
Let me introduce you to some of my ancestors and DNA-tested cousins in the image below. Skip to the next paragraph if this type of family tree diagram is familiar to you. If it’s not, what follows is a description of the diagram and a reminder of relationship terminology and abbreviations. In the image, I’m at the bottom in a light blue box. My dad is immediately above me, then my granddad, then my great-grandparents, Walter Hale Davis and May (Hilton) Davis in green. All the cousins that I share with the ancestral couple of Walter and May are in green. SG, CP, MR, and I are second cousins, because second cousins share great-grandparents. PK, CP’s parent, my dad, MR’s parent, and JS are all first cousins to each other because they share Walter and Mary as grandparents. Since I am one generation younger than these first cousins, I am their first cousin once removed (1C1R). Moving up the diagram, Walter’s parents were William Hale Davis and Sarah Jane (Ellis) Davis. A descendant of Walter’s sibling has also done a DNA test. RD is shown in a light green to match William and Sarah Jane. Since William and Sarah Jane are RD’s great-grandparents and RD is one generation older than me, we are second cousins once removed (2C1R). And up at the top are my 3x-great grandparents, Rev. T.O. Ellis, MD and his wife, Elizabeth (Long) Ellis, in the dark green. I share this ancestral couple (T.O. and Elizabeth) with two cousins (siblings, GS and DM) also in dark green in the lower right. T.O. and Elizabeth are the 2x-great grandparents of GS and DM, so we are third cousins once removed (3C1R).
Ancestors and corresponding DNA matches in relationship to me
MyHeritage and FamilyTreeDNA allow DNA testers to download the segments you share with your DNA matches. If you know your relationship to a DNA match, you can assign the segment to an ancestral couple. In the image below of Chromosome 1, I started by “painting” the DNA from my great-grandparents, Walter Hale Davis and May (Hilton) Davis with green. You always receive DNA from great-grandparents, so that’s a great place to start painting your DNA. I painted the segment data from two 1C1R (PK and JS) and three 2C (SG, CP and MR). I didn’t really need SG since their parent has also tested, but it is a good illustration of how DNA segments tend to get smaller every generation. The lightest green match (RD) is a 2C1R who shares my 2x great-grandparents, William Hale Davis and Sarah Jane (Ellis) Davis. If you look at the comparison of PK to RD, you can see that RD is contained within the green segment from my great-grandparents. This makes sense. The DNA from PK came from either my Davis ancestor or my Hilton ancestor, and it’s clear that most or all of it came from Davis, since I don’t share Hilton ancestors with RD. Then I have two siblings, DM (13.2 cM) and GS (11.8 cM) who both descend from my 3x-great grandparents, Rev. Thomas Oliver Ellis, MD and Elizabeth (Long) Ellis. The same pattern holds: the segment fits within the segment from RD, who is both a Davis and an Ellis. Dark green is either Ellis or Long or both.
Detail of Chromosome 1 DNA Public Version of a DNA Painting at DNA Painter.com
I may some day find a cousin who descends from Rev. Ellis’ father, Josiah Shelton Ellis, or more distant ancestors, but the chances get increasingly remote as we go further back in time. If an ancestor has no or few siblings, the line could have died out. If there are recent immigrants, they may not be in the testing databases. By using this methodology, I can be more confident that a smaller segment came from a more distant ancestor. Note: The smallest segments I painted are both over 10 cM and came from 3x great-grandparents and 3C1R matches. The average segment size for a 3C1R is 16 cM based on simulated data from Leah Larkin.
If you are interested in using segment data, consider encouraging your matches to upload to GEDmatch or test at FamilyTreeDNA or MyHeritage. Why? It’s free to upload your DNA to GEDmatch. Tests at FamilyTreeDNA and MyHeritage are using new technology in their DNA testing as of 2026. In addition to being able to gather the data for chromosome painting, there are other useful tools for genealogy at MyHeritage and FamilyTreeDNA.
The constant plea: Test the oldest generations of your family now!
We can enhance our reach by testing the oldest generation. They will have larger segments to work with and are one step closer to your ancestors. If you have any older relatives (parents, aunts, uncles, cousins one generation older), buy a DNA test for them. (Watch for sales!) Then visit them personally and make sure they do all the steps for the DNA kit to be activated and usable. At this point in time, I would test them at Ancestry and at either MyHeritage or FamilyTreeDNA. Another factor to consider is that mtDNA and YDNA testing can be added to tests at FamilyTreeDNA.
Summary
Genetic genealogists avoid using small segments when making genealogical conclusions. There is science behind the limitations of DNA matching. Genetic genealogy needs to be treated like documentary research: start with the present and work your way back.
I’ve always been a fan of what used to be called “Citizen Science” and has recently been re-named “Community Science.” I contribute birding data to ebird. I was a volunteer atlasser for the BC Breeding Bird Survey in its early days and I continue to support my husband on the annual survey. We start at the crack of dawn and he counts birds while I drive and keep the tally.
I’m excited to have the opportunity to support genetic genealogy. Blaine Bettinger, the genetic genealogist who is behind the Shared cM Project on DNA Painter, has opened submissions for the next update. The goal is over 100,000 submissions. He hopes to release the update in early 2023. Now’s the time to contribute! There are two ways to do it.
Through this spreadsheet link which is a great option of you have a lot of data.
If you are unfamiliar with the Shared cM Project, it is the go-to place to check genetics vs. genealogy. That’s the step in the analysis when you see if you and your DNA match share the amount of cM that will help you confirm or figure out a relationship. You can get these predictions from each of the testing companies. That’s the notation by your match that says “2nd-3rd Cousin.” Each company uses their own data and information, which could be based on faulty trees. What’s different about the Shared cM data is that it is crowd-sourced. Genealogists who have confirmed the relationships through documentary research provide the data. That’s us! This will be my third time contributing data.
The latest genetic genealogy features and tools bring excitement and potential for new insights. The combination of Ancestry’s Ethnicity Inheritance Chromosome Painter and Jonny Perl’s ACPS (Ancestry Chromosome Painter Segments) tool allows comparison of Ancestry data with information from other testing companies. Jonny’s new tool uses the information from Ancestry to grab <<gasp>> segment data <<gasp>>. It’s not the segment data you’ve been hoping for (segments shared with matches) but it’s fun and potentially useful depending on your situation.
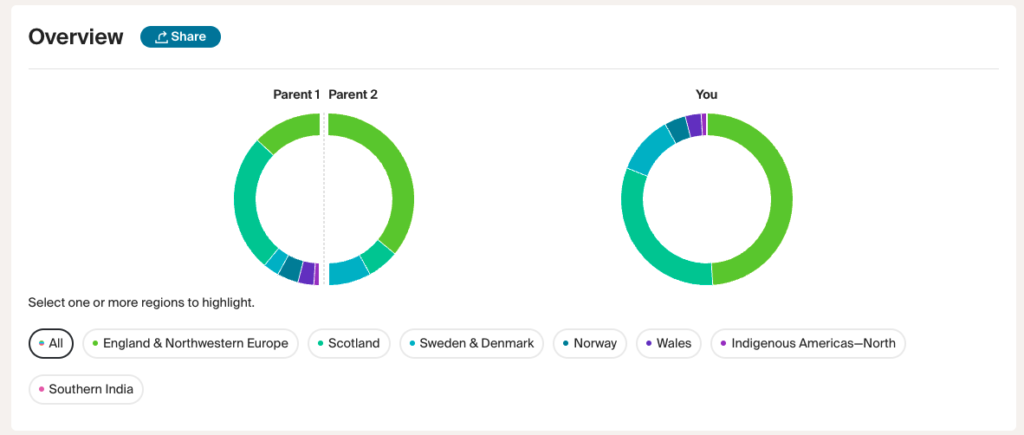
Several months ago, Ancestry released ethnicity results with “Side View” technology. Side View allows you to see which ethnicity you received from each of your two parents. Unless you’ve had a parent tested or recognize which parent is which, the two parents are simply labelled “Parent 1” and “Parent 2.” You can label them yourself.
Here’s my mother’s ethnicity split into the contributions from her two parents.
Ancestry Ethnicity Inheritance Overview Showing ethnicity for each parent of my mother
Ancestry is now rolling out the beta feature of a chromosome painter for ethnicity, catching up with 23andMe and FamilyTreeDNA who already offer this feature.
My mother’s results on Ancestry look like this:
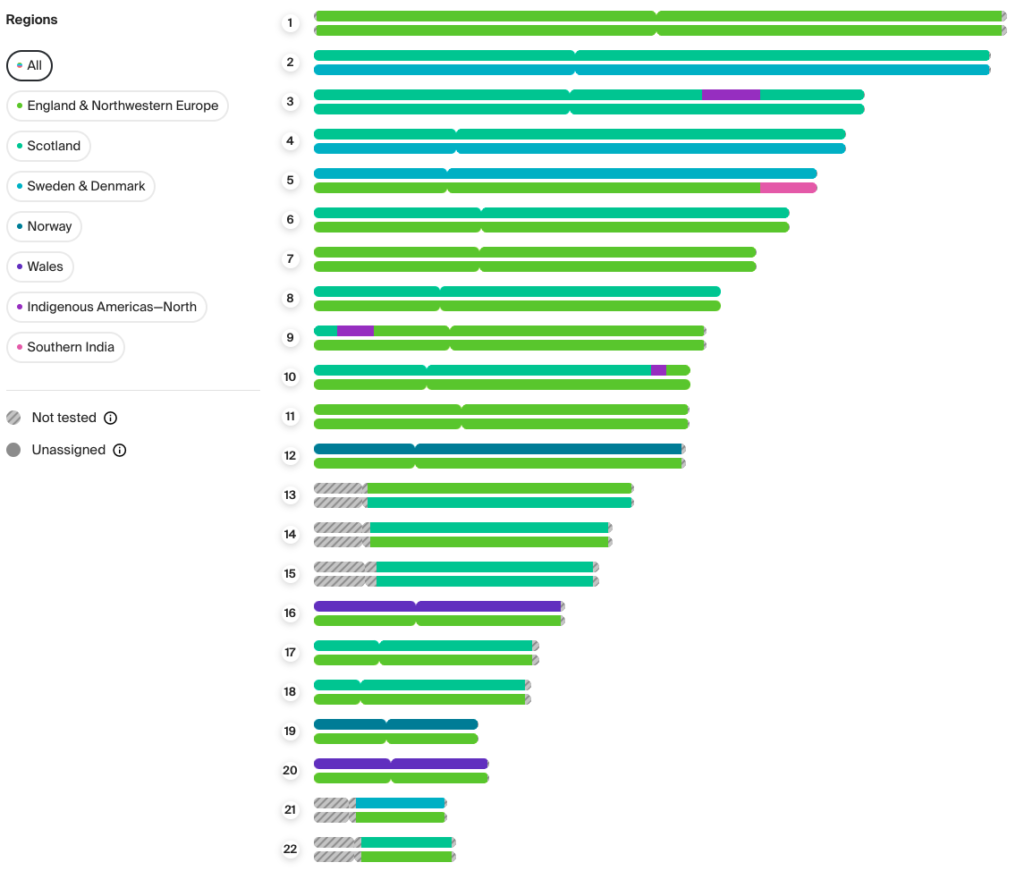
Ancestry’s Ethnicity Inheritance Chromosome Painter for my mother
Each numbered pair represents my mother’s chromosomes, 1-22 (chromosome 23 is the chromosome that determines biological gender and Ancestry does not show the results of chromosome 23.) One chromosome of the pair is from my mother’s dad and one chromosome from her mother. The different colours represent different ethnicities, which refer to geographic locations. As you can see, my mother’s ancestry is primarily European, and largely from England and Northwestern Europe. As of this moment, I don’t know which of the two (upper or lower chromosome) is my maternal grandfather and which is my maternal grandmother. My mom has three segments labelled “Indigenous Americas-North” and one labelled “Southern India.”
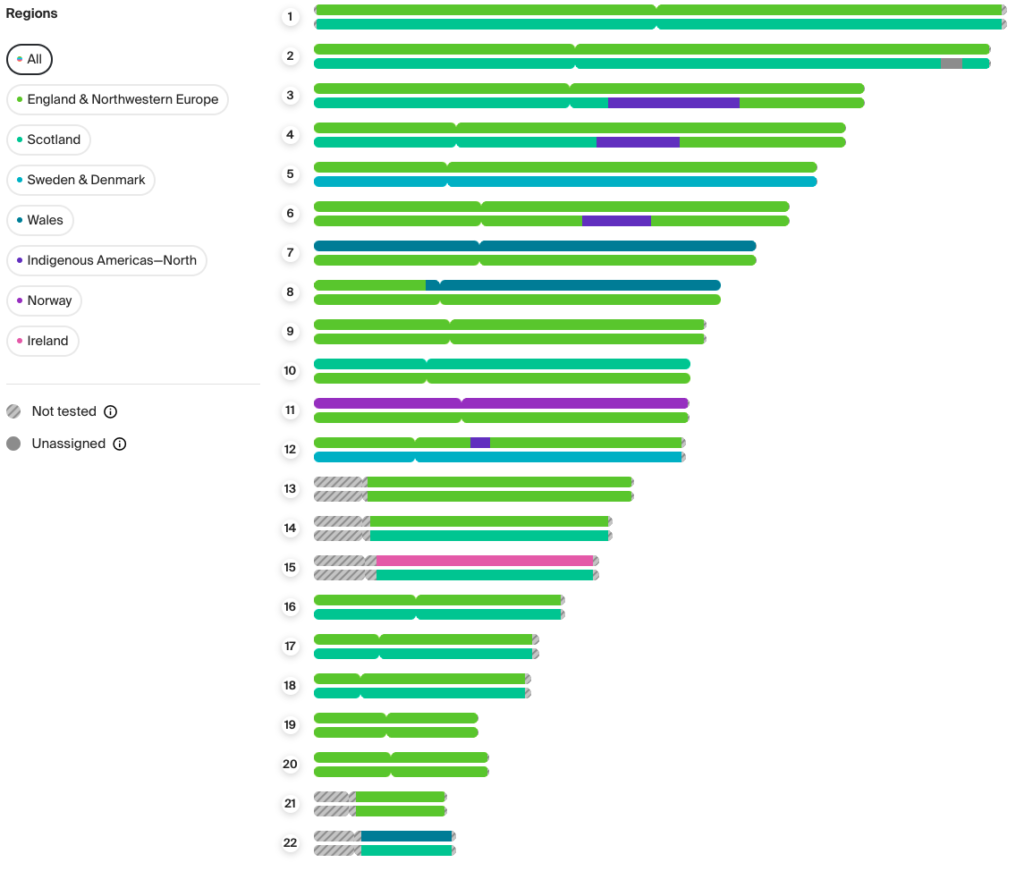
My maternal uncle’s Ancestry Ethnicity Inheritance Chromosome Painter results look like this:
Ancestry’s Ethnicity Inheritance Chromosome Painter for my maternal uncle
Notice the colours in the key are not stable, which is a shortcoming of the Ancestry Chromosome Painter and their ethnicity results in general. It would be useful for Norway to be the same colour no matter whose DNA test I am looking at. Norway is blue for my mom and purple for my uncle. And then there are the two shades of purple that are similar – Norway and Indigenous Americas for my uncle. And all the shades of green, aqua, blue, darker aqua… more variety would be helpful. I’m grateful for the information and I can edit the colours when I move the segment data to DNA Painter using Jonny’s new tool. My uncle has four segments labelled Indigenous Americas. They are on chromosomes 3, 4, 6, and 12.
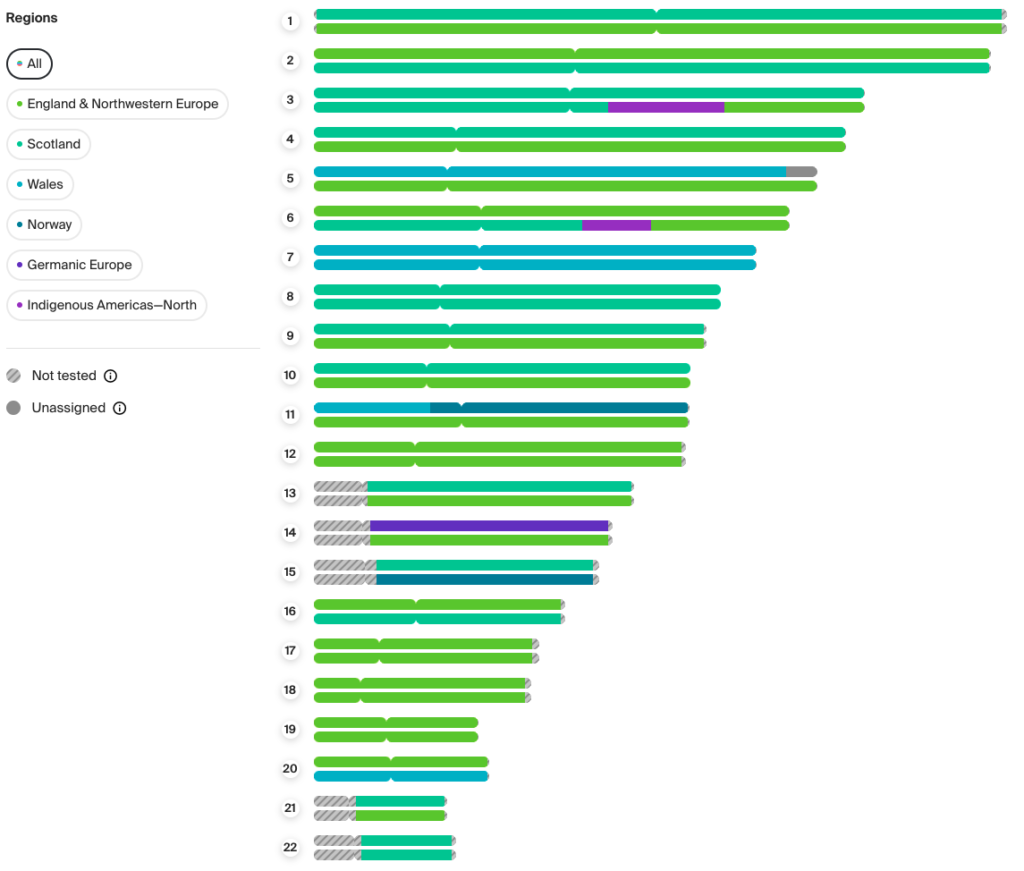
Here is my maternal aunt:
Ancestry’s Ethnicity Inheritance Chromosome Painter for my maternal aunt
My aunt has a new category, Germanic Europe, and two Indigenous America’s segments. When comparing the three images, it’s important to remember that Ancestry randomly assigned Parent 1 (upper chromosome) and Parent 2 (lower chromosome). My mother’s seems to be reversed from her siblings since the “Indigenous Americas” segment on chromosome 3 is Parent 1 for my mom and Parent 2 for my uncle and aunt.
Jonny Perl’s new tool allows me to copy and paste the data that creates the Ancestry image and make a file I can manipulate at DNA Painter. (To learn how to use DNA Painter, there are several good webinars with demonstrations and resources here.) Jonny used known information about DNA to approximate the start and stop points from the Ancestry chromosome images to make this work.
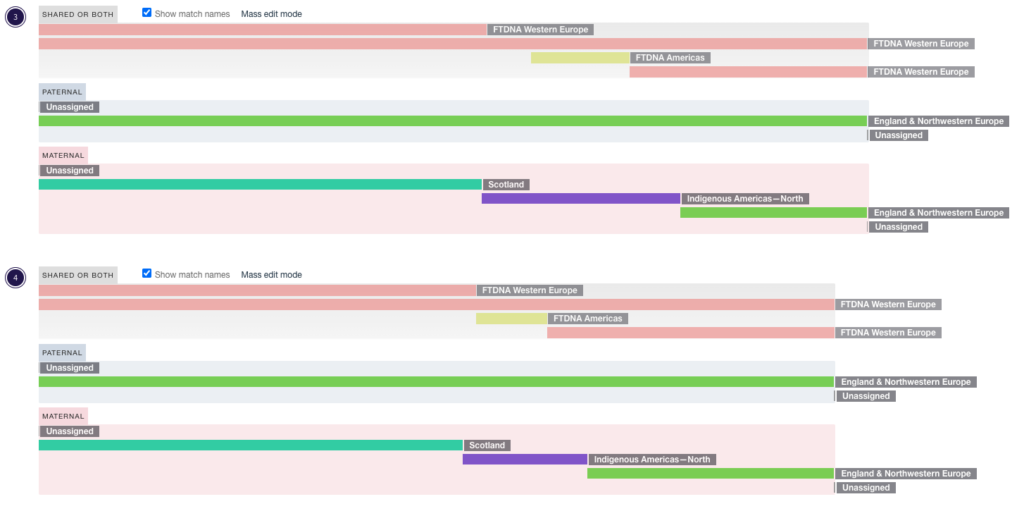
Ethnicity results can be compared across the companies. Remember my uncle who had several chromosomes with Indigenous Americas on Ancestry? Here I’ve uploaded his FamilyTree DNA ethnicities on the same DNA Painter diagram as his Ancestry ethnicity. I’m showing the detail for chromosomes 3 and 4.
FamilyTree DNA and Ancestry Ethnicity results compared for my maternal uncle
FamilyTree DNA results for both maternal and paternal chromosomes are mapped to “Shared or Both” because I don’t know which chromosome is maternal and which is paternal. Ancestry DNA chromosomes are artificially labeled maternal and paternal. FamilyTree DNA uses fewer ethnicity labels than Ancestry. Nearly all of my uncle’s DNA is labelled “Western Europe” and shows up as a darker pink bar. Ancestry separates “England & Northwestern Europe” shown in green and Scotland in aqua. FTDNA’s “Americas” segments in green are not as extensive as the approximated “Indigenous Americas-North” from Ancestry via Jonny Perl’s new tool. This may change if Ancestry ever allows a real download of raw ethnicity data. The Indigenous Ancestry is a small percentage of my uncle’s DNA but seeing it detected by both companies increases my confidence in the segments.
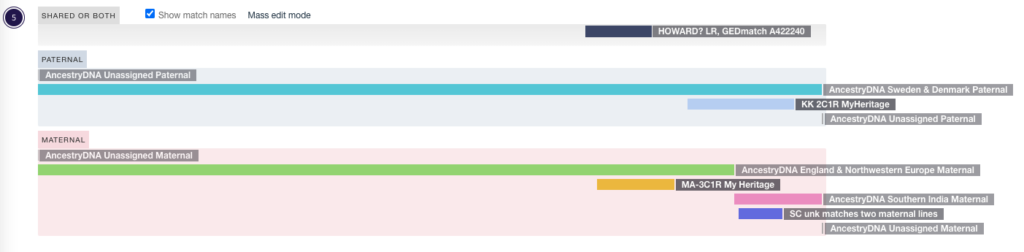
The segment on my mother’s chromosome 5 that is attributed to Southern India caught my attention. I’ve painted matches from GEDmatch, MyHeritage, and FamilyTreeDNA to DNA Painter. (My mom is not on 23andMe, which is the other testing site with segment data.). I was curious to see if there were any matches corresponding to that unusual segment.
Chromosome 5 ethnicity and matches for my mother
Remember that the Ancestry ethnicity segments which are imported as maternal or paternal could be the other way around. In this case, there is an unknown maternal match for SC (in bright pink) that does seem quite similar to the Southern India segment. I will keep an eye on this, it could be helpful in the future.
I’m encouraged by the new developments and hope they unlock mysteries for you.
I look forward to learning about the new tools and updates that come from DNA testing companies. Recently Ancestry.com updated their genetic communities. Genetic communities demonstrate the link between genetic genealogy and traditional documentary genealogy research. Ancestry uses the family trees of customers and the power of their massive autosomal DNA database (over 21 million testers) to place groups of ancestors in a place and time. The time frame (starting about 300 years ago) matches the time period when documentary evidence might be found. DNA communities provide hints for further research.
Autosomal DNA inheritance is random and siblings (unless they are identical twins) will have different results. My brother and I each received half of our atDNA from our dad and half from our mom, but we didn’t get the same half.
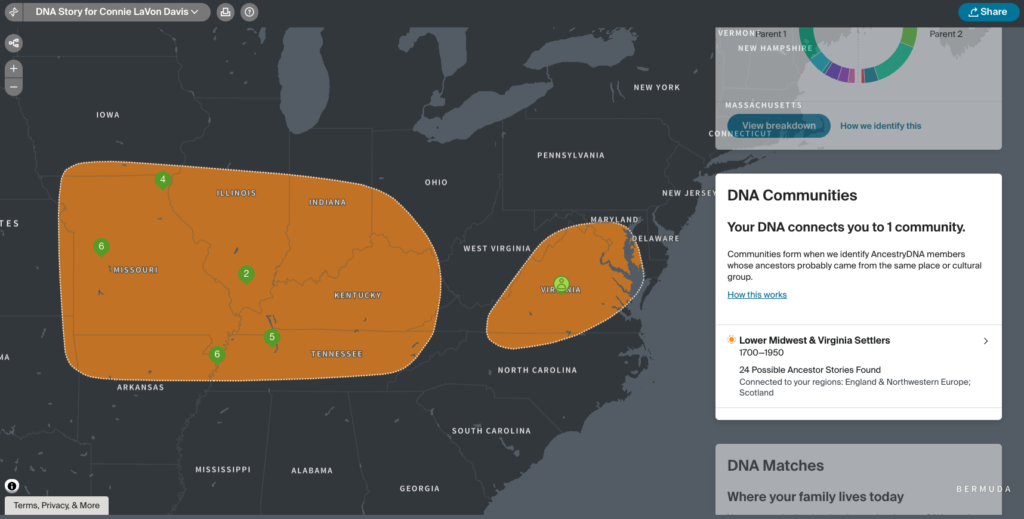
My results aren’t very impressive:
My DNA Communities from Ancestry.com
I have one community. Clicking through the information tells me which DNA matches and which ancestors fit in this group.
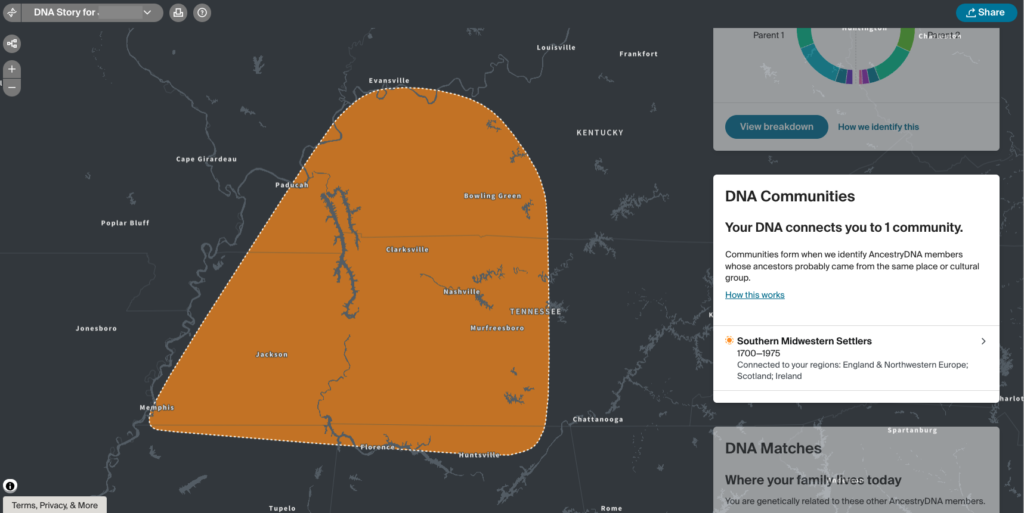
Here are the results for my brother:
My Brother’s DNA Communities from Ancestry.com
The DNA Community for my brother is different than the one I have. One of the same 4x-great grandfathers on my maternal side, Holloway Key (1777-1855), is in both groups. This makes sense since the geographic area of Tennessee where he settled appears in both. For my paternal side, there are hints I can pursue in the Lower Midwest & Virginia Settlers group for the House family that I am curious about.
I tested my mother before she passed away, and her brother (my maternal uncle) also agreed to test. That puts me one generation closer to my maternal ancestors.
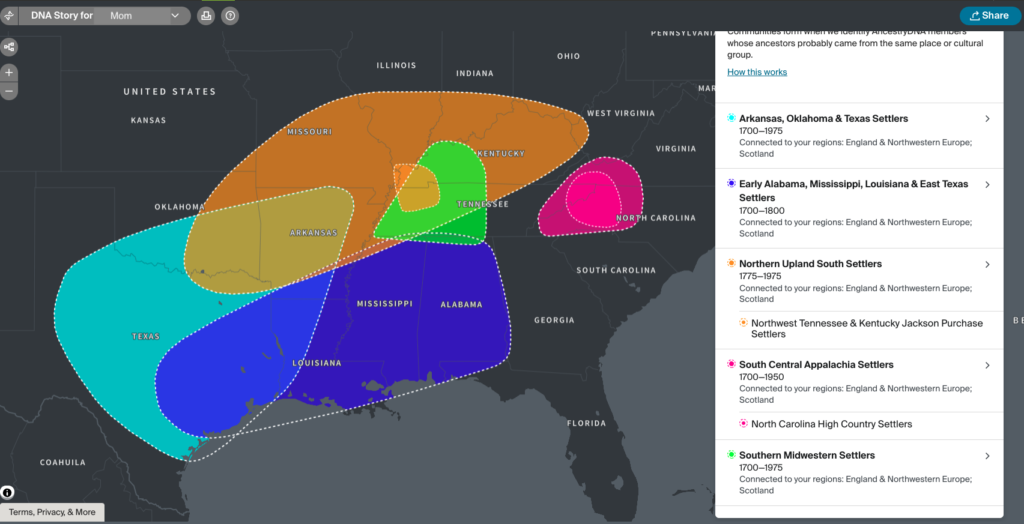
Here are my mother’s results:
My Mother’s DNA Communities on Ancestry
Not only does my mother have the DNA community my brother had, Southern Midwestern Settlers (his is orange, hers is green), she has four others.
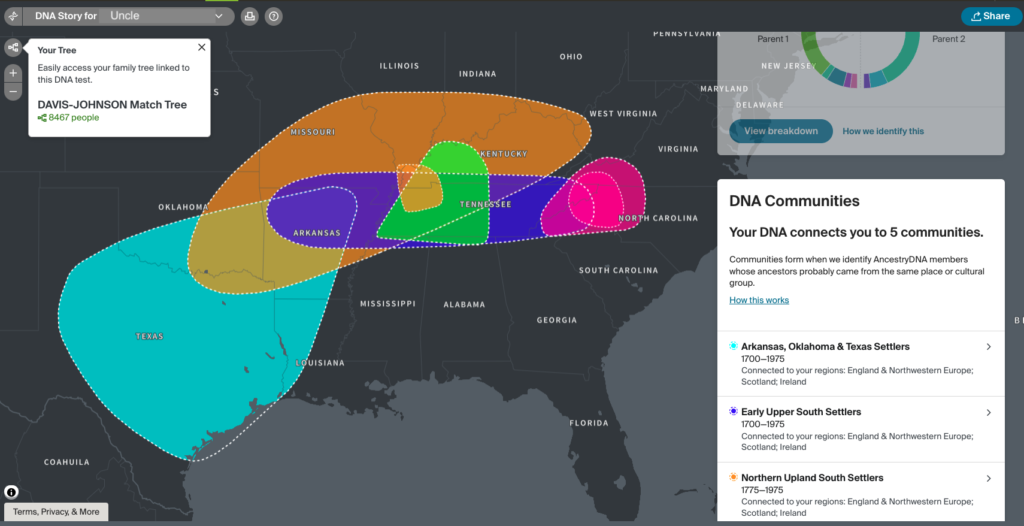
My uncle provided an additional community, Early Upper South Settlers:
My Maternal Uncle’s DNA Communities on Ancestry
The results differ a little, and that’s because of the different autosomal DNA they inherited from their parents (my maternal grandparents). The number of new communities demonstrates the rich genetic information older generations hold.
Here’s a comparison of the results for the four of us:
Region
Mother
Uncle
Me
Brother
Arkansas, Oklahoma & Texas Settlers (1700-1975)
√
√
Early Alabama, Mississippi, Louisiana & East Texas (1700-1800)
√
Early Upper South Settlers (1700-1975)
√
Lower Midwest & Virginia Settlers (1700-1950)
√
North Upland South Settlers (1775-1975 Northwest Tennessee & Kentucky Jackson Purchase Settlers
√
√
South Central Appalachia Settlers (1700-1950) North Carolina High Country Settlers
√
√
Southern Midwestern Settlers (1700-1975)
√
√
√
Comparison of DNA Communities for My Mom, My Maternal Uncle, Myself and My Brother at Ancestry
The text describing the community, animated maps showing migration patterns, and hints from Ancestry provide clues that I can research. We don’t know anything about my maternal 2x great-grandmother, Mattie (Childres) Fisher Pike Adams outside of 3 marriages and 1 census. Ancestry placed this branch in the “Arkansas, Oklahoma and Texas Settlers” with origins in Northwestern Europe and the British Isles, possibly migrating to the Chesapeake Bay area and moving across Tennessee and Kentucky. This is consistent with the Childres matches I am researching.
If I did not have my mother and my uncle, I would I would be missing five genetic communities. Perhaps in the next update, the DNA communities will show up for my brother and me. I welcome the new clues in my search for Mattie’s family.